Main Quotes Calendar Forum
flag

FX.co ★ Ichimoku cloud indicator analysis of gold for February 19, 2018

parent
Forex Analysis:::2018-02-18T22:46:15

Ichimoku cloud indicator analysis of gold for February 19, 2018

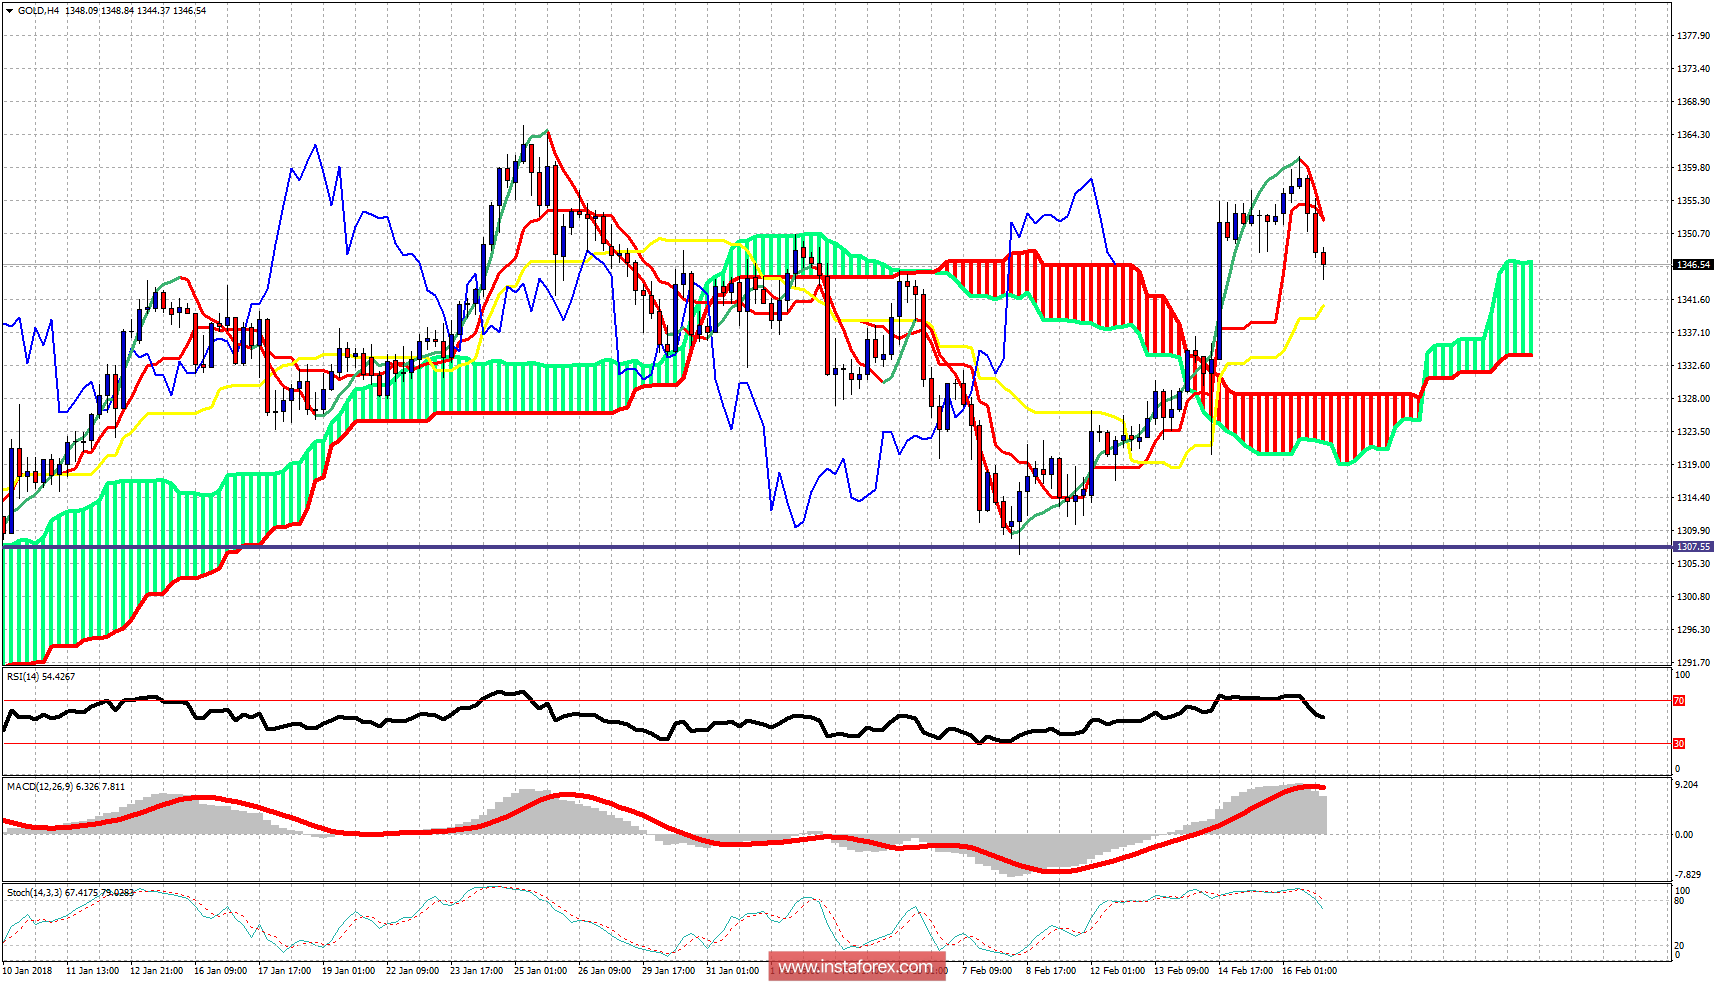
Gold price remains in a bullish trend. Price is making greater highs and lows while trading near its $1,350 long-term resistance. Despite a briefly breaking above it, Gold ended the week below this crucial long-term resistance.

Ichimoku cloud indicator analysis of gold for February 19, 2018

In the 4 hour chart, Gold is above the Kumo (cloud). Price is pulling back after a sharp move higher from $1,334 to $1,360. Support is at $1,340 and next at $1,328. As long as Gold price is above the second support level, bulls will remain in control. A break of price below the Kumo (cloud) would be a bearish sign.

Ichimoku cloud indicator analysis of gold for February 19, 2018

Red line - long-term resistance

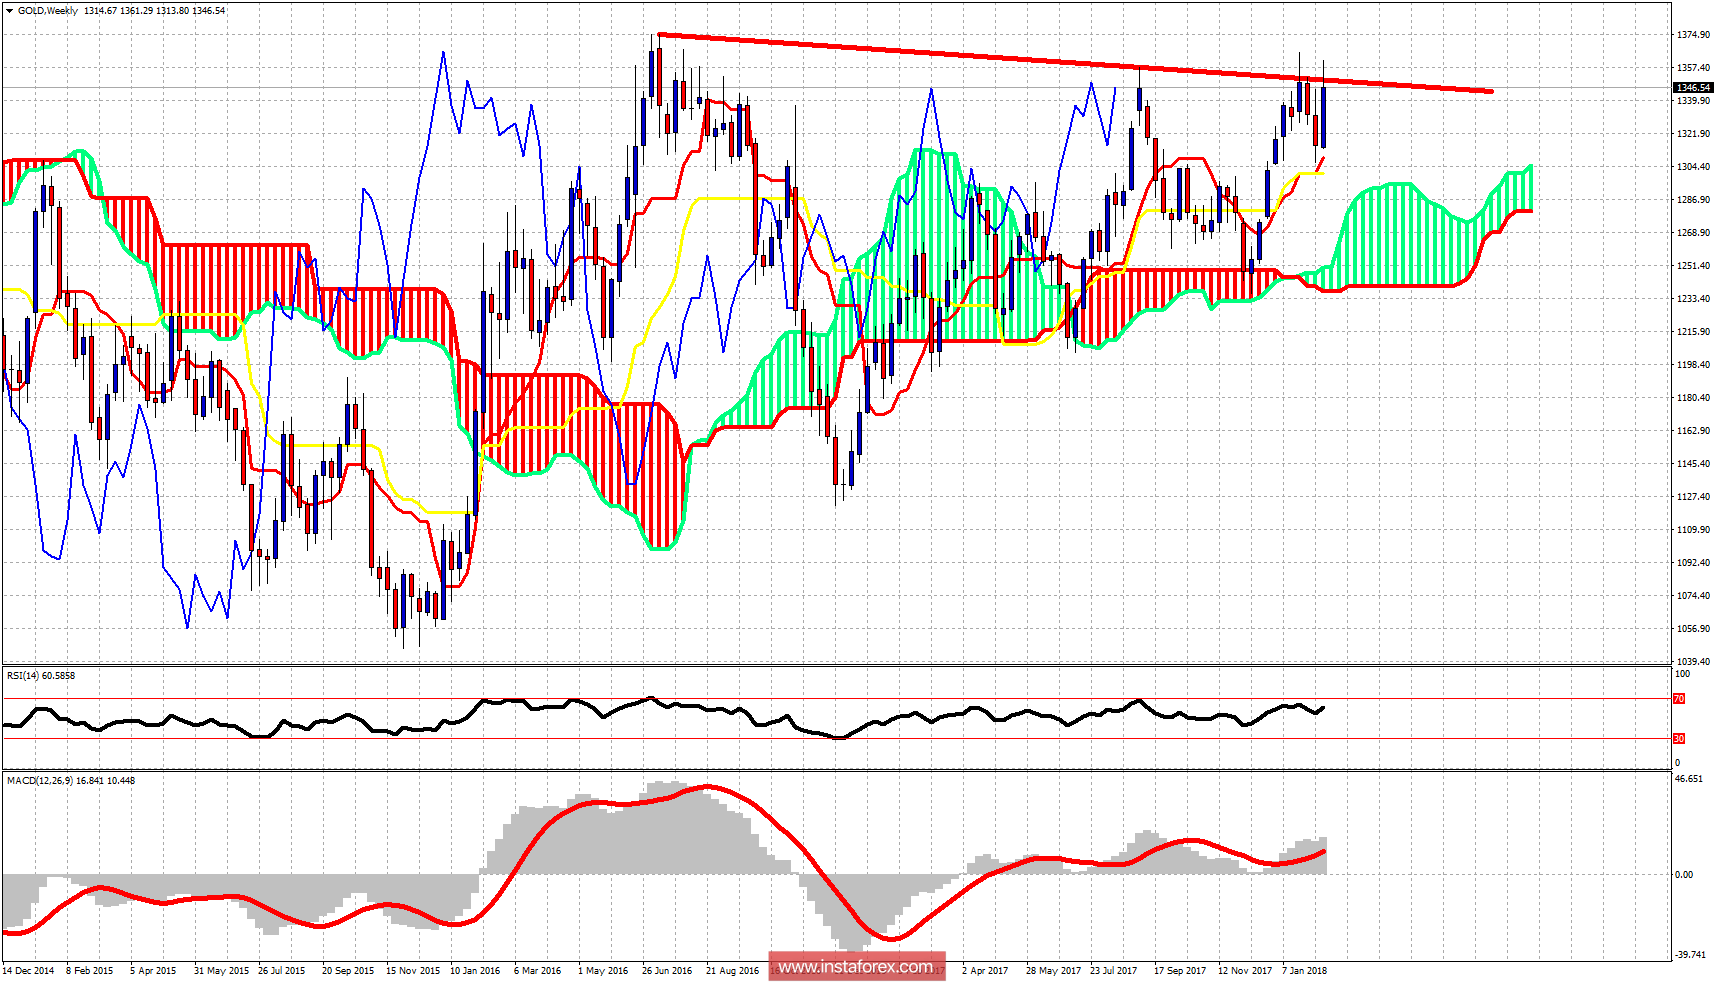
On a weekly basis, we still did not get the weekly close above the long-term resistance trend line. Weekly support is at $1,309-$1,304. As long as the price is above that area, the weekly trend remains bullish, and Gold targets $1,390.

Analyst InstaForex
Share this article:
parent
loader...
all-was_read__icon
You have watched all the best publications
presently.
We are already looking for something interesting for you...
all-was_read__star
Recently published:
loader...
More recent publications...