


USDX managed to do a rebound above the 88.20 level, supporting the recovery scenario, and the 200 SMA at H1 chart could provide a dynamic resistance. However, that area could affect the index in lacking momentum to post fresh highs. If it does a pullback, then the next area of testing should be at the level of 87.88.
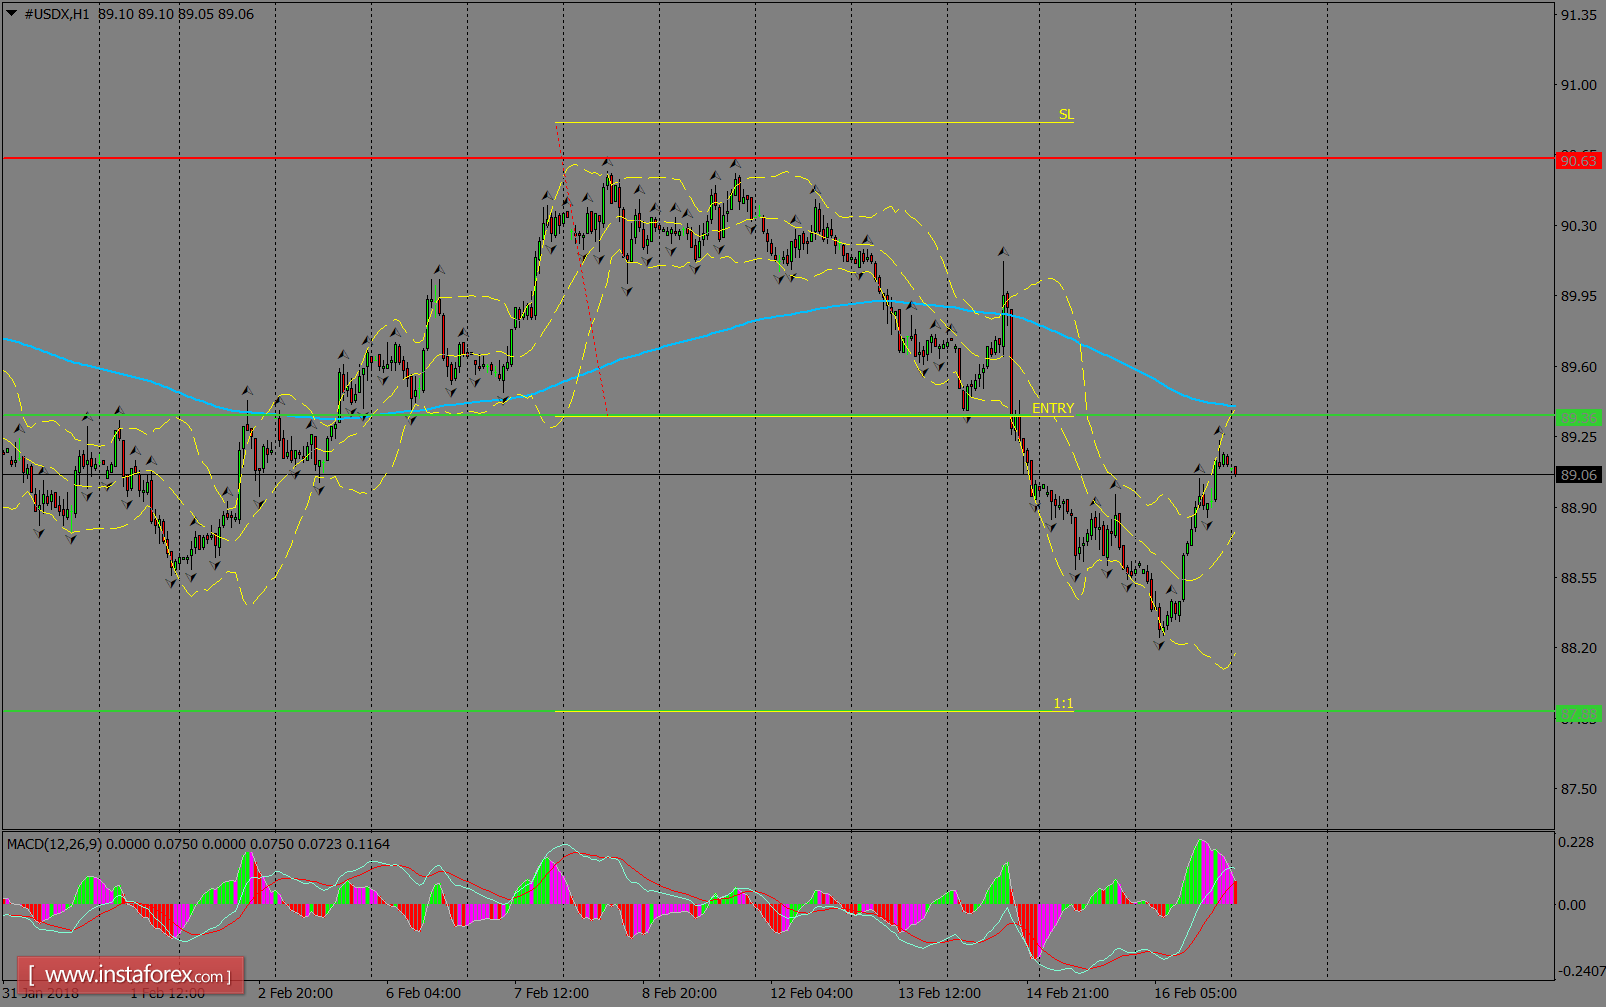
H1 chart's resistance levels: 90.63 / 91.75
H1 chart's support levels: 89.36 / 87.88
Trading recommendations for today: Based on the H1 chart, place sell (short) orders only if the USD Index breaks with a bearish candlestick; the support level is at 89.36, take profit is at 87.88, and stop loss is at 90.81.


