


The index is breaking above the 200 SMA following a fresh-buying interest seen in the greenback during the last few days and now it's targeting the resistance zone of 90.63. However, due to the broad-based weakness in USD, we're expecting that it resumes the bearish trend below the 200 SMA at H1 chart and tests the support area of 87.88. MACD indicator is turning neutral, favoring to a sideways idea.
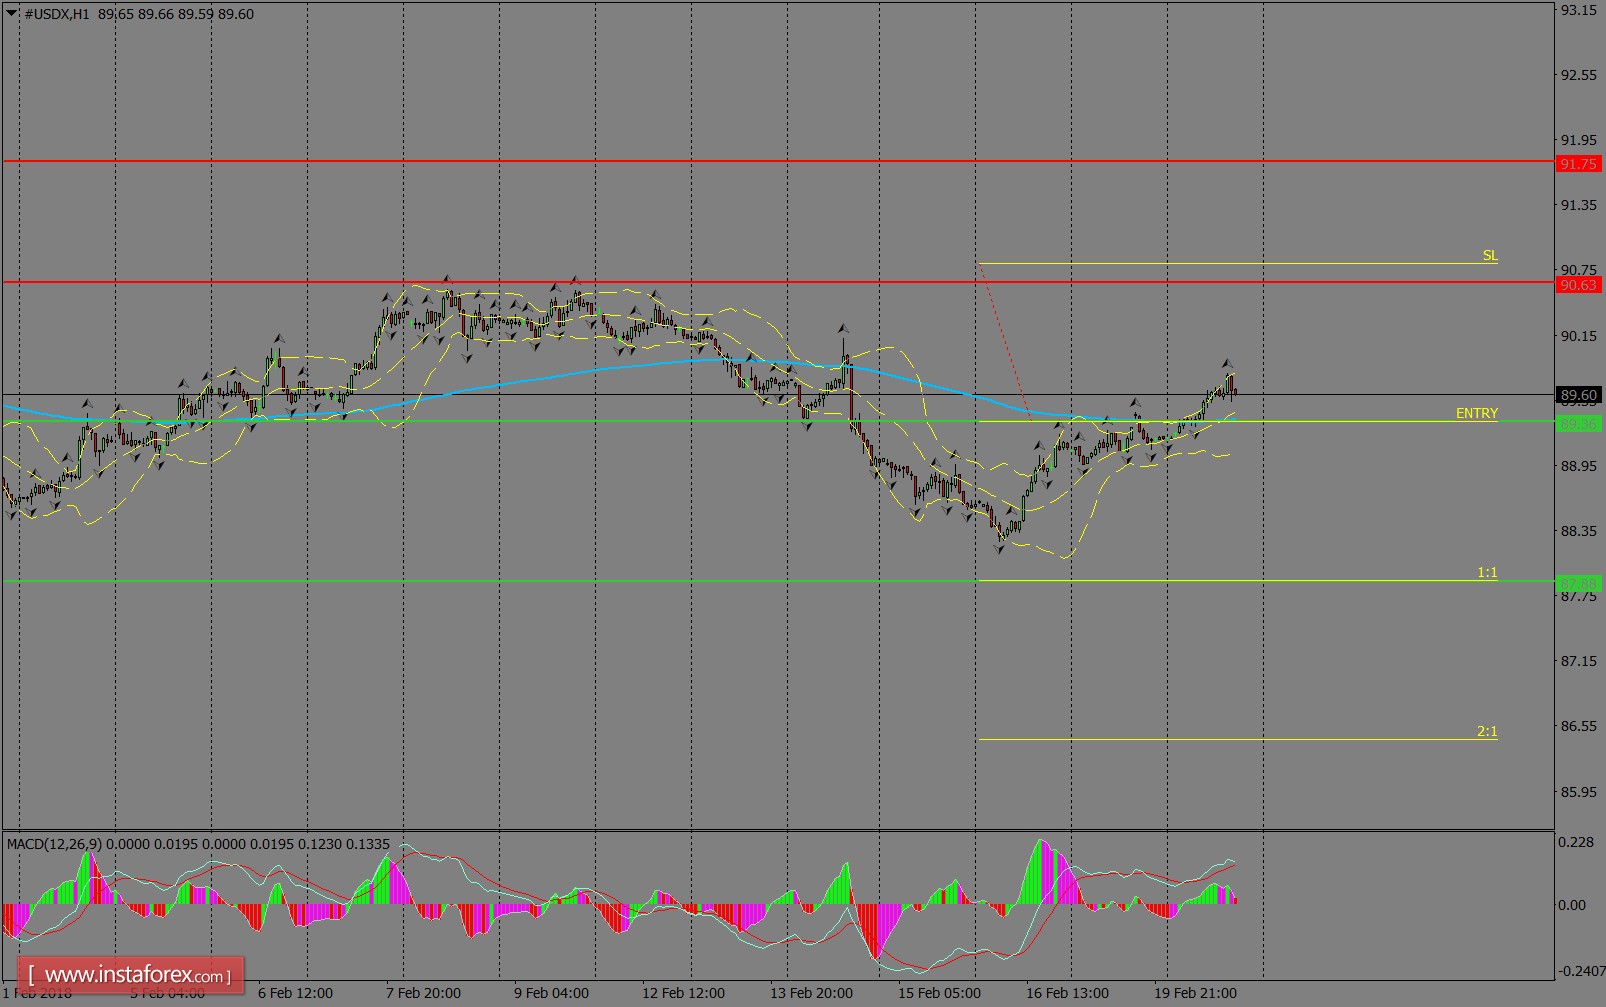
H1 chart's resistance levels: 90.63 / 91.75
H1 chart's support levels: 89.36 / 87.88
Trading recommendations for today: Based on the H1 chart, place sell (short) orders only if the USD Index breaks with a bearish candlestick; the support level is at 89.36, take profit is at 87.88 and stop loss is at 90.81.


