


The index had a bearish session on Thursday and it's expected to test the 200 SMA anytime soon. The support zone of 89.36 still holds across the board and we forecast a possible breakout below that area in order that USDX plummets toward the 87.88 level. MACD indicator is supporting the aforementioned bearish idea, as it stays in the negative territory.
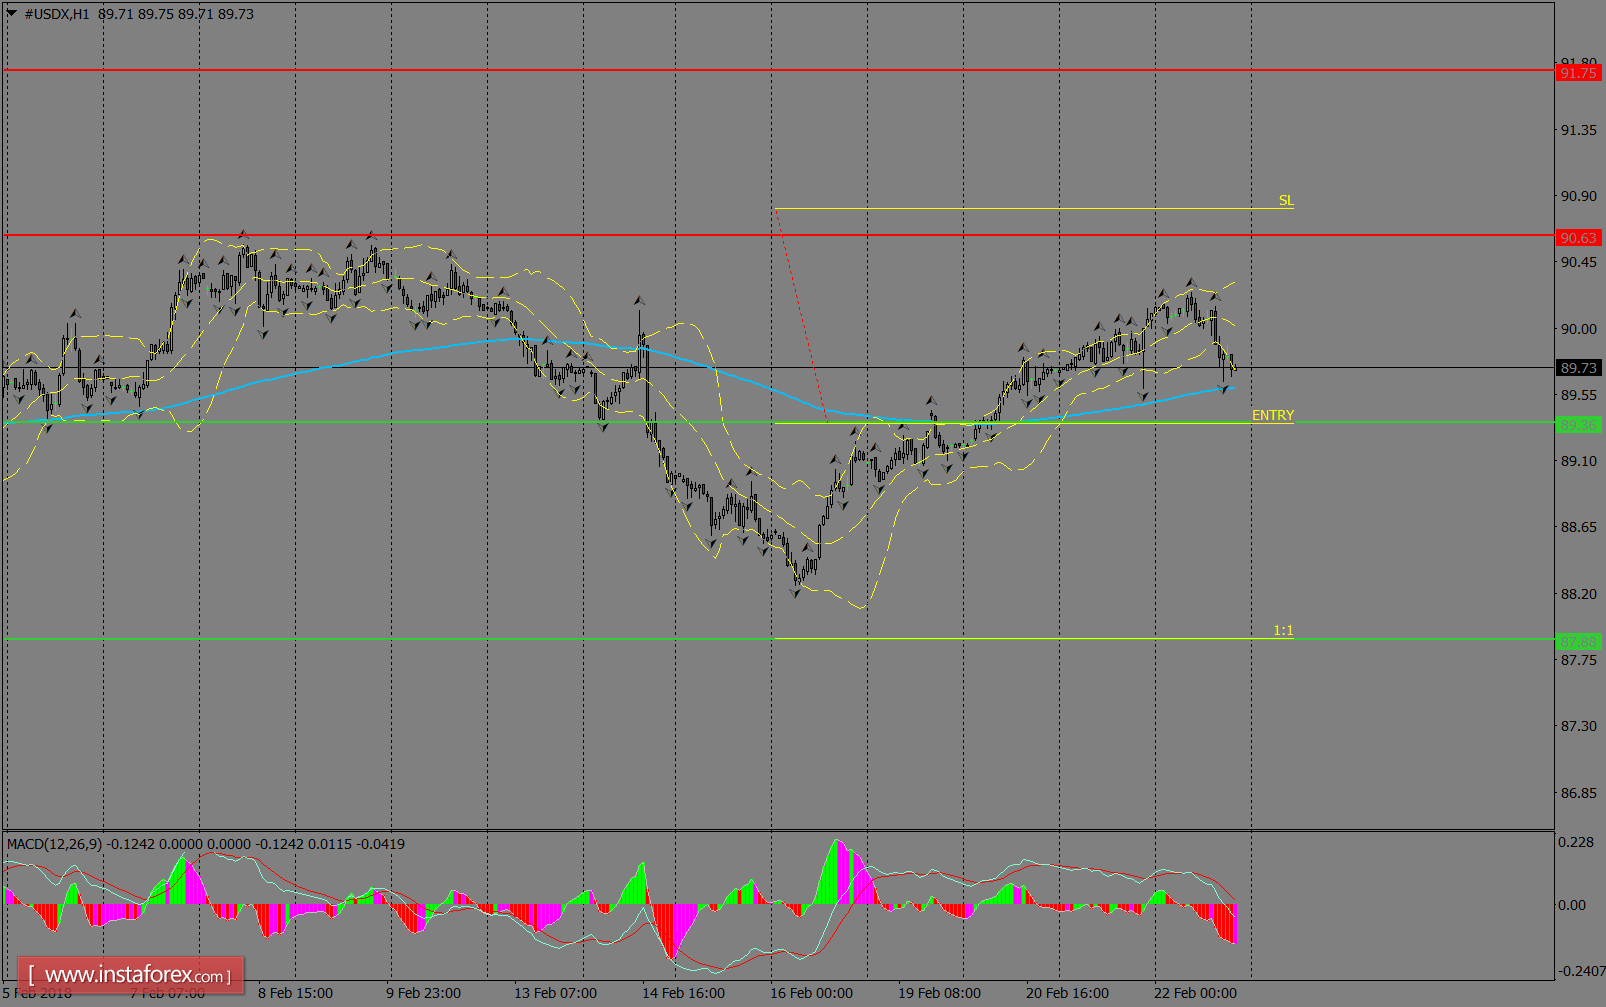
H1 chart's resistance levels: 90.63 / 91.75
H1 chart's support levels: 89.36 / 87.88
Trading recommendations for today: Based on the H1 chart, place sell (short) orders only if the USD Index breaks with a bearish candlestick; the support level is at 89.36, take profit is at 87.88 and stop loss is at 90.81.


