


USDX still consolidates the price action well above the 200 SMA at the H1 chart and it seems the 90.63 level is the next target to test. If the index does a break below the 89.36 level, then the doors will open for a testing of the 87.88 level, in a move which should strengthen the bearish bias. MACD indicator remains in the neutral territory, calling for further consolidation.
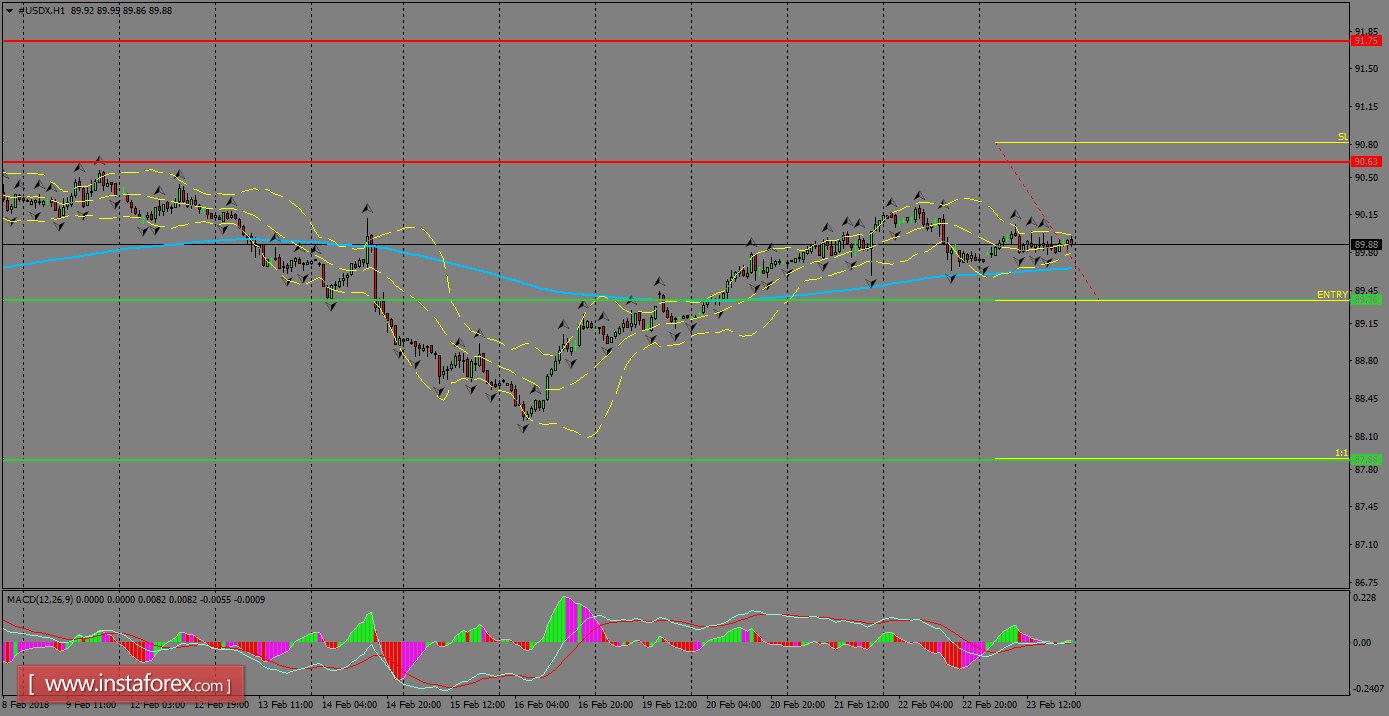
H1 chart's resistance levels: 90.63 / 91.75
H1 chart's support levels: 89.36 / 87.88
Trading recommendations for today: Based on the H1 chart, place sell (short) orders only if the USD Index breaks with a bearish candlestick; the support level is at 89.36, take profit is at 87.88 and stop loss is at 90.81.


