


The bears are trying to keep alive the momentum in the index, as it's struggling to consolidate above the 200 SMA at H1 chart. The support zone of 89.36 remains intact, and a break below it should expose the 87.88 level. To the upside, if a rebound happens at the current stage, the next target would be the 90.63 area. MACD indicator is turning flat, calling for sideways.
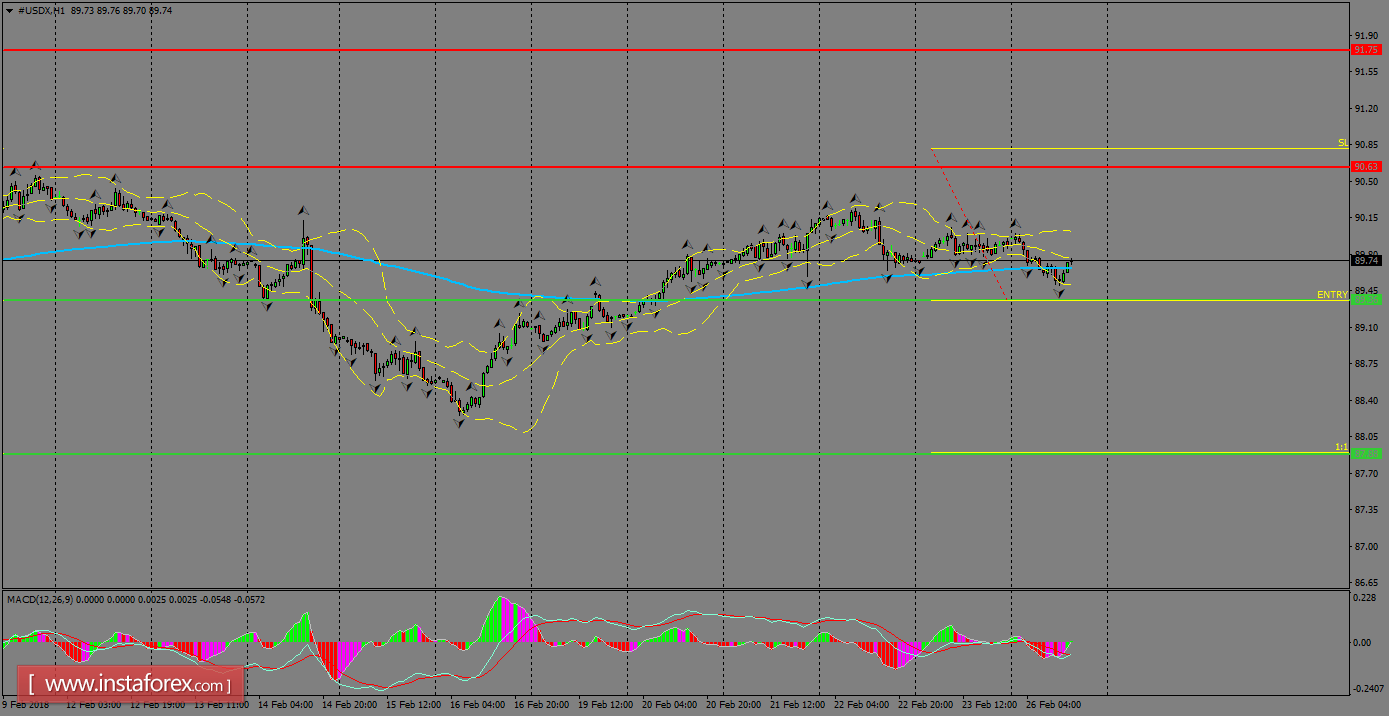
H1 chart's resistance levels: 90.63 / 91.75
H1 chart's support levels: 89.36 / 87.88
Trading recommendations for today: Based on the H1 chart, place sell (short) orders only if the USD Index breaks with a bearish candlestick; the support level is at 89.36, take profit is at 87.88, and stop loss is at 90.81.


