


USDX still remains confined within a range around the 200 SMA at H1 chart, which is helping to provide dynamic support across the board. The highs from February 22th are still in place and the index should break them in order to extend the rally towards the 90.63 level. However, if it manages to break below 89.36, the nearish structure could strengthen.
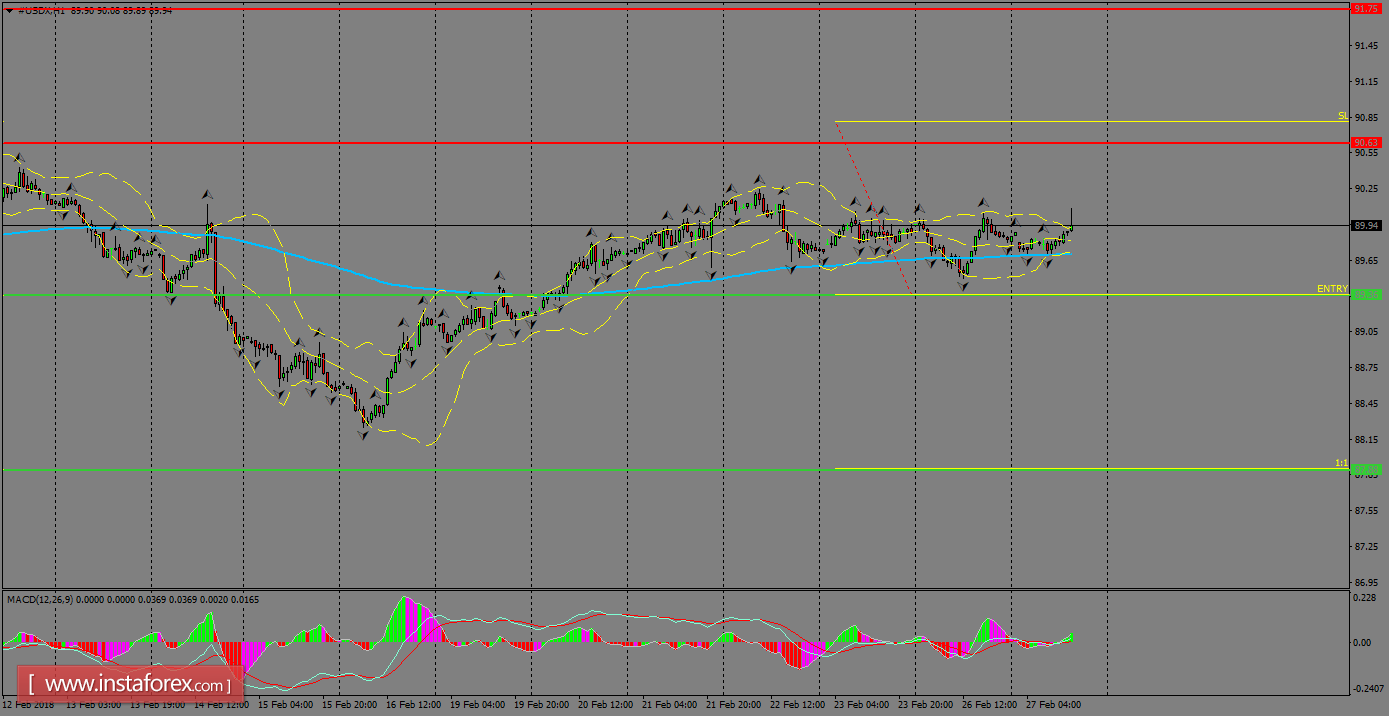
H1 chart's resistance levels: 90.63 / 91.75
H1 chart's support levels: 89.36 / 87.88
Trading recommendations for today: Based on the H1 chart, place sell (short) orders only if the USD Index breaks with a bearish candlestick; the support level is at 89.36, take profit is at 87.88 and stop loss is at 90.81.


