


The index comatose inside a sideways range capped by the resistance level of 90.63. If it breaks above such area, USDX could be on its way to reach the 91.75 level, while to the downside, if USDX manages to make a pullback, then the 200 SMA could be tested in the short.term. MACD indicator supports the current quiet price action.
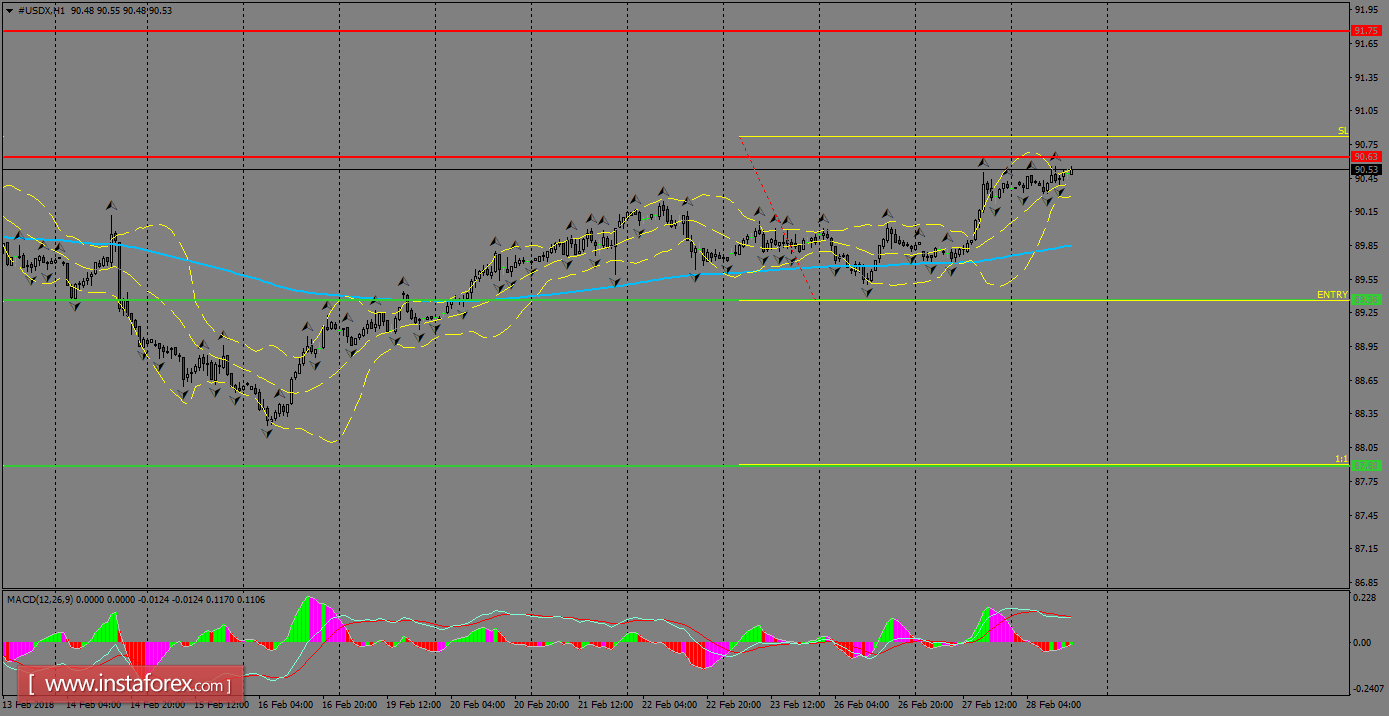
H1 chart's resistance levels: 90.63 / 91.75
H1 chart's support levels: 89.36 / 87.88
Trading recommendations for today: Based on the H1 chart, place sell (short) orders only if the USD Index breaks with a bearish candlestick; the support level is at 89.36, take profit is at 87.88 and stop loss is at 90.81.


