


Gold price broke to new lows yesterday and reached $1,302. However price held above $1,300 where the lower cloud boundary in the daily chart was and price bounced as Dollar weakened.
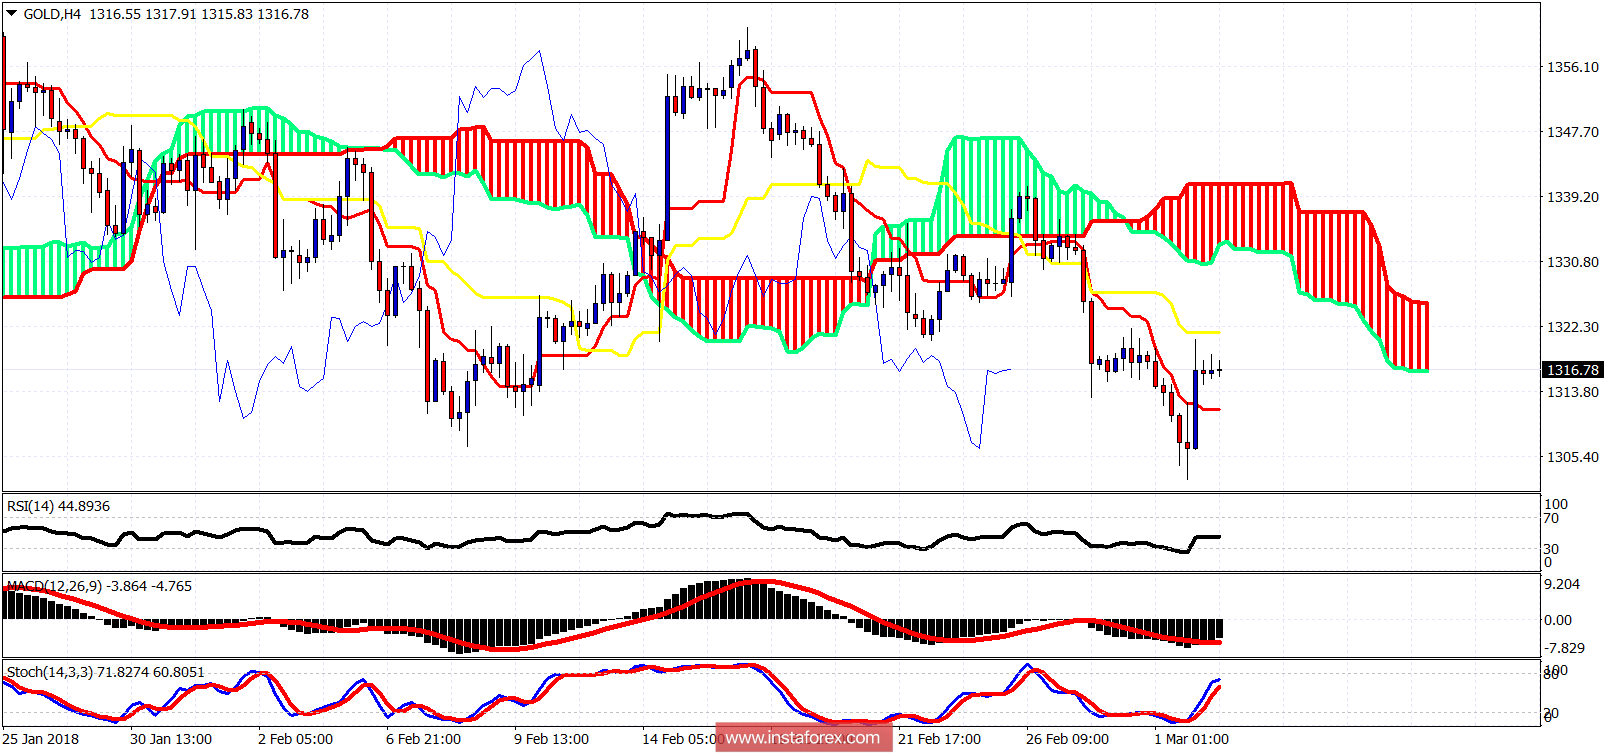
Gold price is still trading below the 4-hour Ichimoku cloud. Resistance is at $1,331. Support at yesterday's lows. Price is making lower lows and lower highs. We also have resistance at $1,322. A rejection and inability to break above this level, will increase the chances of seeing new lows below $1,300.
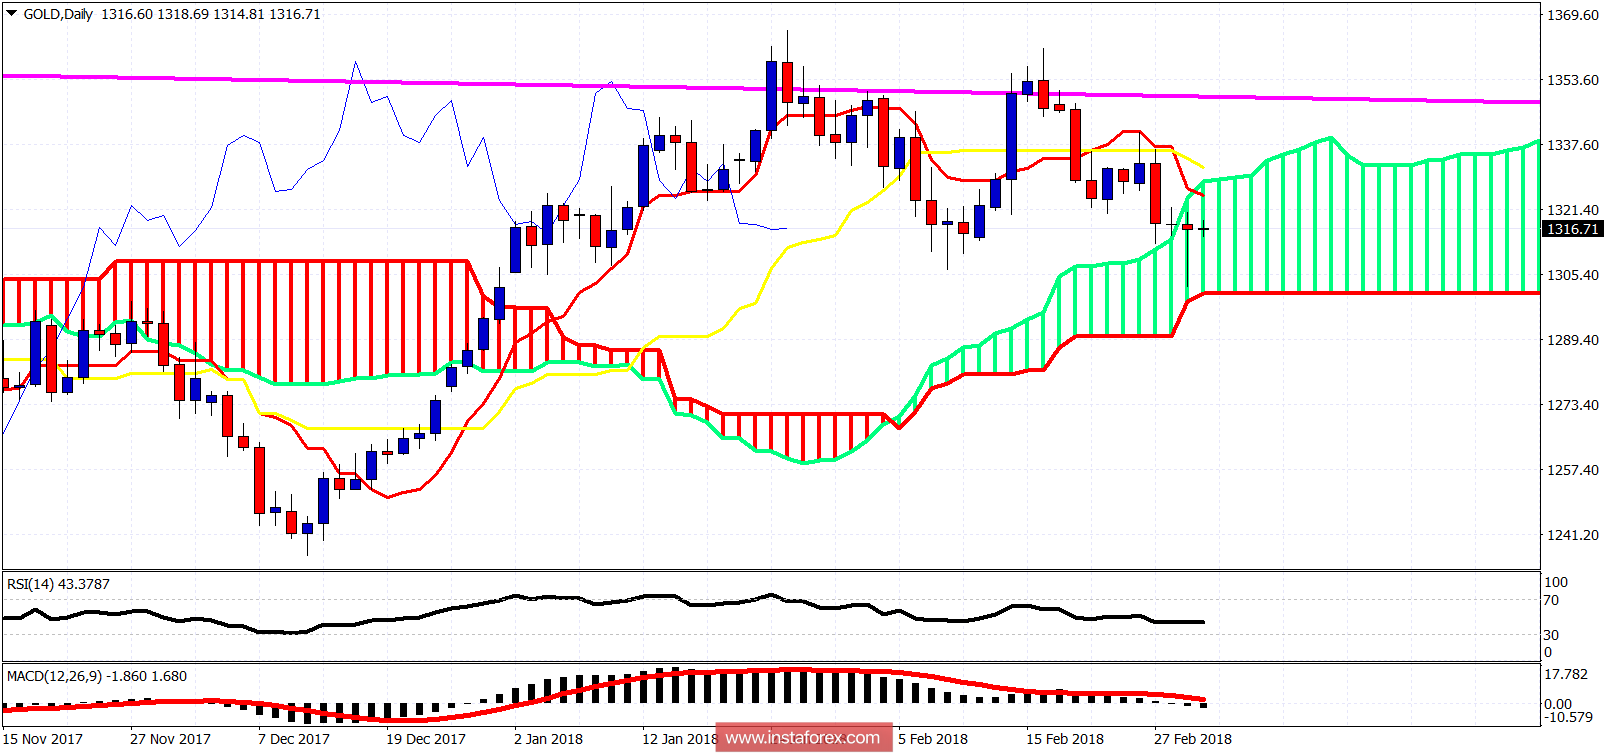
On a daily basis Gold reached as expected the lower cloud boundary. Price bounced but still remains inside the Kumo. Support remains strong at $1,300. If broken we could see $1,280-70. Resistance is at $1,334-37. A break above that level will be a very bullish sign.


