


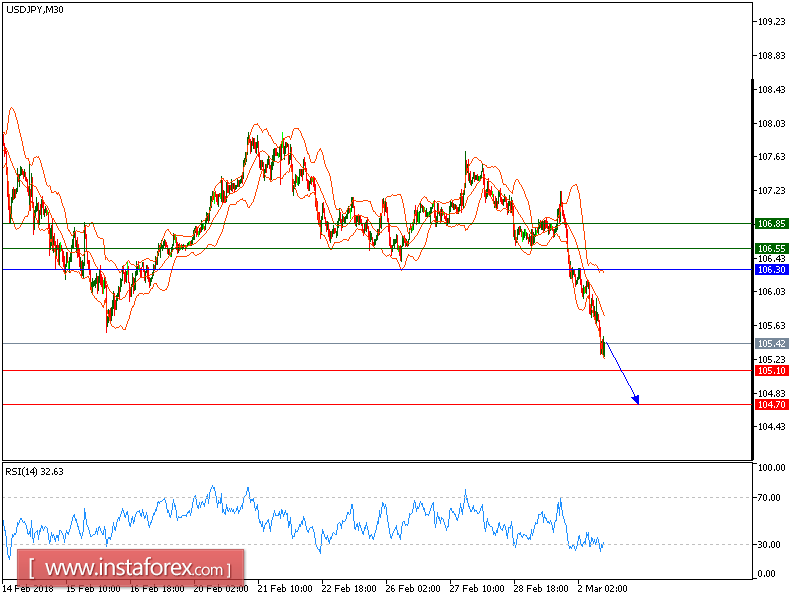
Our previous downside targets which we predicted in yesterday's analysis have been hit. USD/JPY is under pressure and expected to trade with the bearish outlook. The pair broke below the key support at 106.30 (the low of February 28), which becomes the key resistance now. The declining 20-period and 50-period moving averages should push the prices lower. The relative strength index shows downside momentum.
To conclude, as long as 106.30 holds on the upside, look for a further drop with targets at 105.10 and 104.70 in extension.
Alternatively, if the price moves in the opposite direction, a long position is recommended to be above 106.30 with a target of 106.55.
Chart Explanation: The black line shows the pivot point. The current price above the pivot point indicates a bullish position, while the price below the pivot point is a signal for a short position. The red lines show the support levels, and the green line indicates the resistance level. These levels can be used to enter and exit trades.
Strategy: SELL, stop loss at 106.30, take profit at 105.10.
Resistance levels: 106.55, 106.85, and 107.25
Support levels: 105.10, 104.70, and 104.30.


