


USDX still hovers around the 200 SMA at the H1 chart and it's trying to gather momentum in order to continue with the bullish structure above it. However, a pullback to test the support zone of 89.36 could be tested in the near-term and it could get a break to open the doors towards the 87.88 level. To the upside, the nearest resistance lies at 90.63.
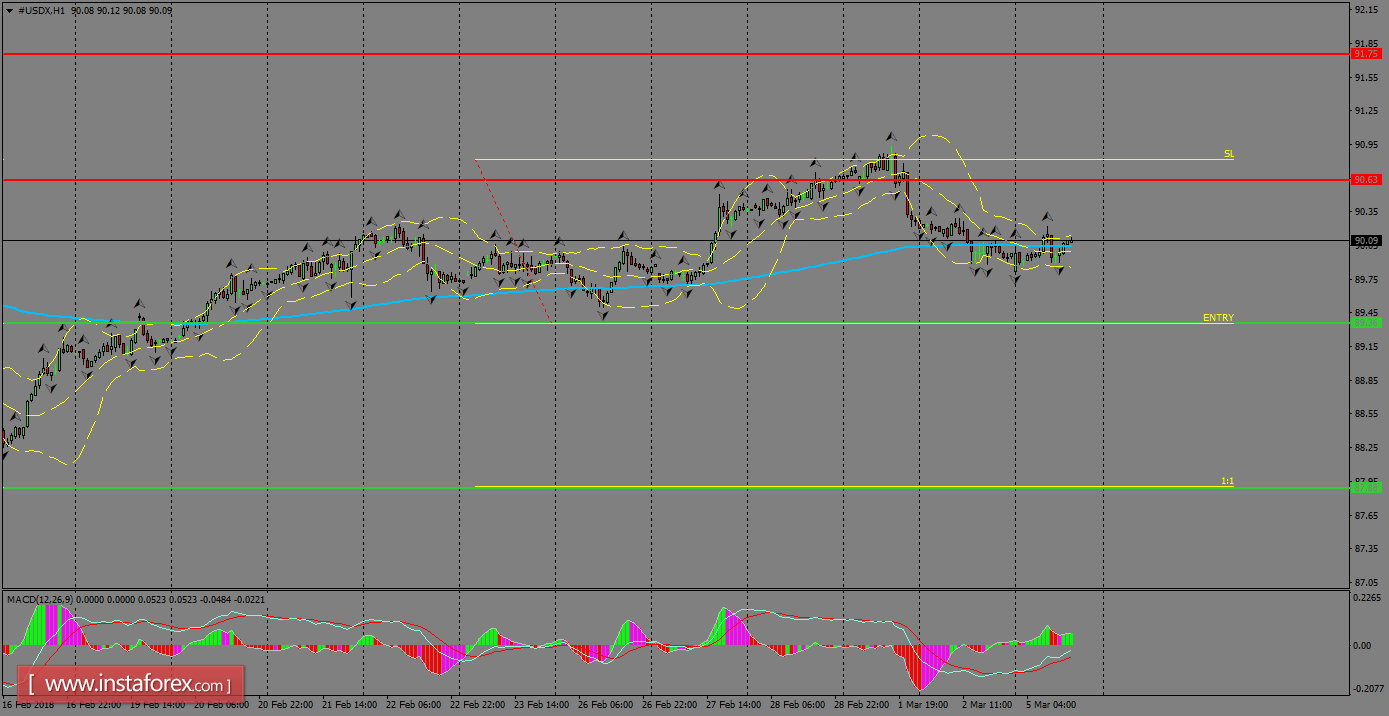
H1 chart's resistance levels: 90.63 / 91.75
H1 chart's support levels: 89.36 / 87.88
Trading recommendations for today: Based on the H1 chart, place sell (short) orders only if the USD Index breaks with a bearish candlestick; the support level is at 89.36, take profit is at 87.88 and stop loss is at 90.81.


