


The index stays under pressure below the 200 SMA on the H1 chart after having a sellers' wave during Tuesday's session. As the greenback is weakening, we can expect a test of the support zone at 89.36, at which a breakout should expose the 87.88 level. To the upside, gains will be limited by the 90.63 area.
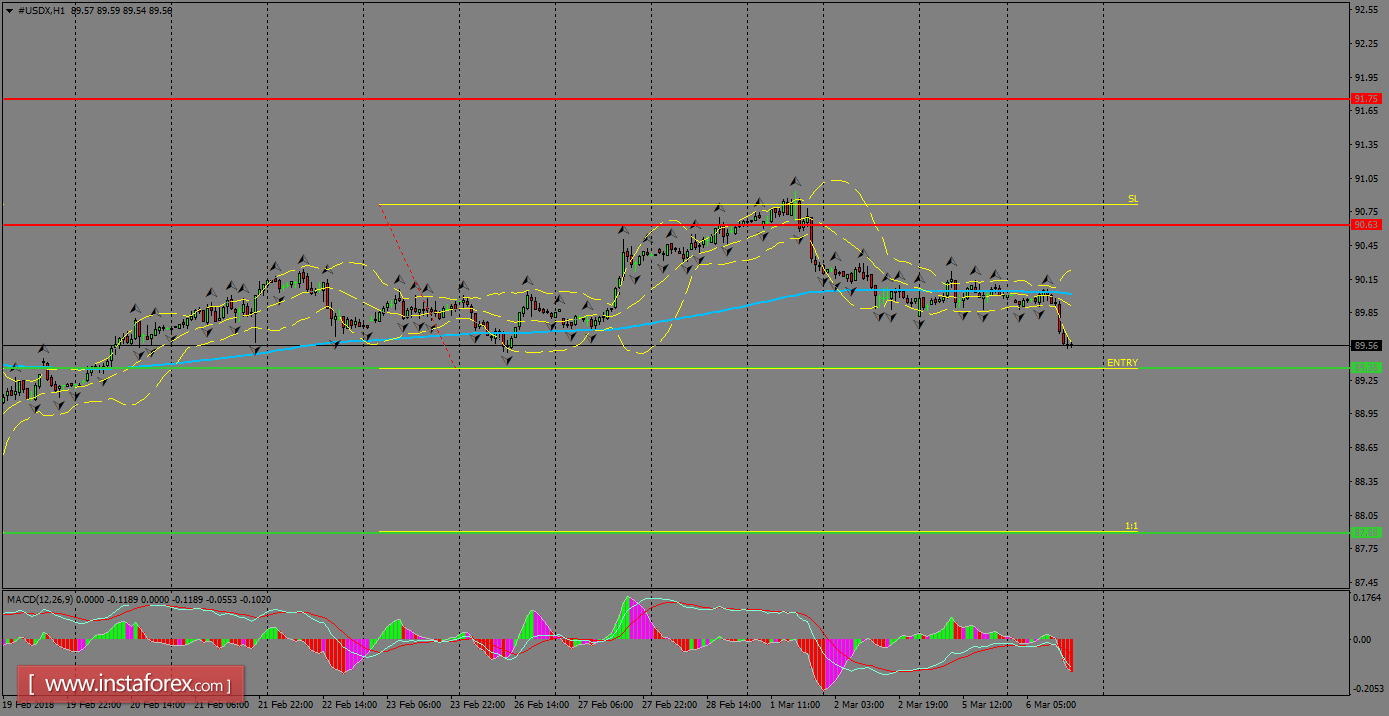
H1 chart's resistance levels: 90.63 / 91.75
H1 chart's support levels: 89.36 / 87.88
Trading recommendations for today: Based on the H1 chart, place sell (short) orders only if the USD Index breaks with a bearish candlestick; the support level is at 89.36, take profit is at 87.88 and stop loss is at 90.81.


