Main Quotes Calendar Forum
flag

FX.co ★ Ichimoku cloud indicator analysis of gold for March 7, 2018

parent
Forex Analysis:::2018-03-07T07:43:53

Ichimoku cloud indicator analysis of gold for March 7, 2018

Gold price is now in a neutral short-term trend after entering inside the Ichimoku cloud of the 4-hour chart. Price reached the upper cloud boundary and got rejected. Gold continues to trade inside a range of $1,310-$1,350.

Ichimoku cloud indicator analysis of gold for March 7, 2018

Short-term resistance is at $1,337. The 4 hour candles did not manage to close above that level and price got rejected. Support is at $1,329. Break this level and we are going lower towards $1,321. Break this and we test $1,307-$1,310 which is the lower boundary of the trading range. Break above resistance at $1,337 and we will test the upper boundary of the trading range at $1,344-50.

Ichimoku cloud indicator analysis of gold for March 7, 2018

Magenta line - resistance

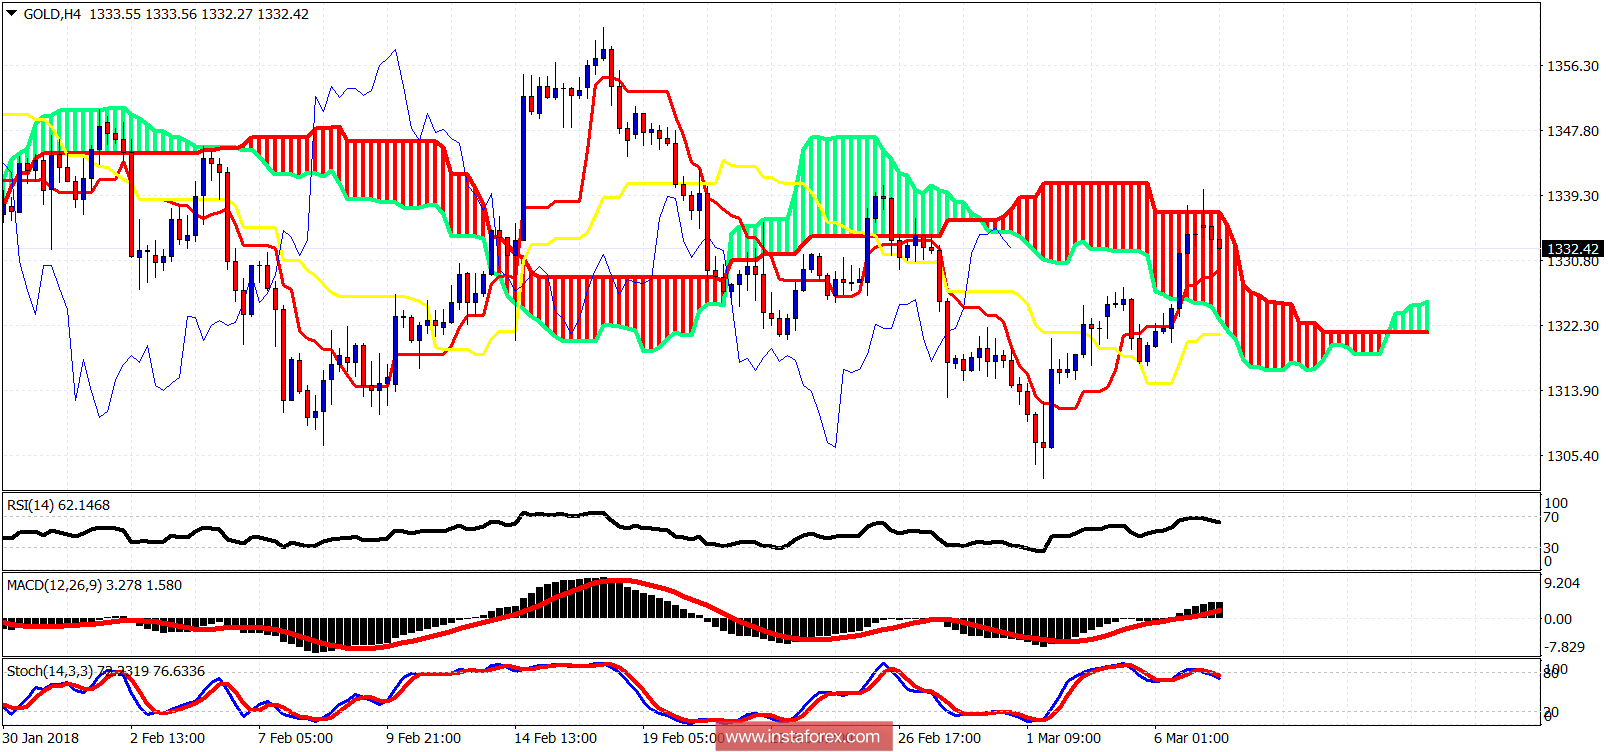
Red trend line -support

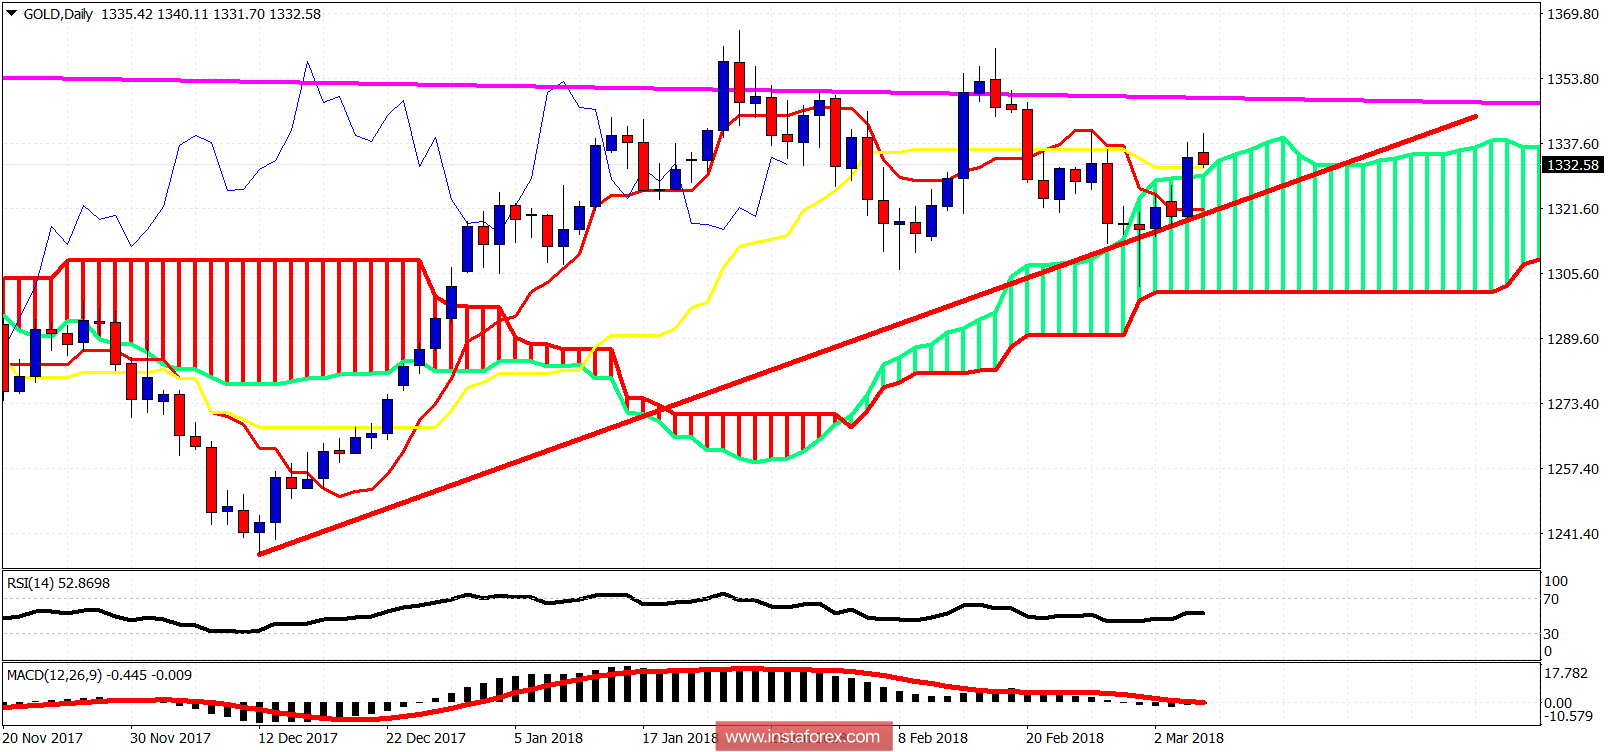
On a daily basis Gold price managed to break and close above the daily Kumo. This is a bullish sign. As long as price does not close back inside the Kumo. If this happens, we should expect a move back towards $1,300-$1,310. The most bullish sign would be to see a break above the long-term resistance trend line (magenta line).

Analyst InstaForex
Share this article:
parent
loader...
all-was_read__icon
You have watched all the best publications
presently.
We are already looking for something interesting for you...
all-was_read__star
Recently published:
loader...
More recent publications...