


The pair continues to trade within a range around the 200 SMA on H1 chart and it seems we can expect a break lower to test the support zone of 1.3753, which is our nearest target to the downside. Such level remains as a key pivot for the Cable in order to strengthen the bearish bias across the board. If that level gives up, then we can expect a support at 1.3608.
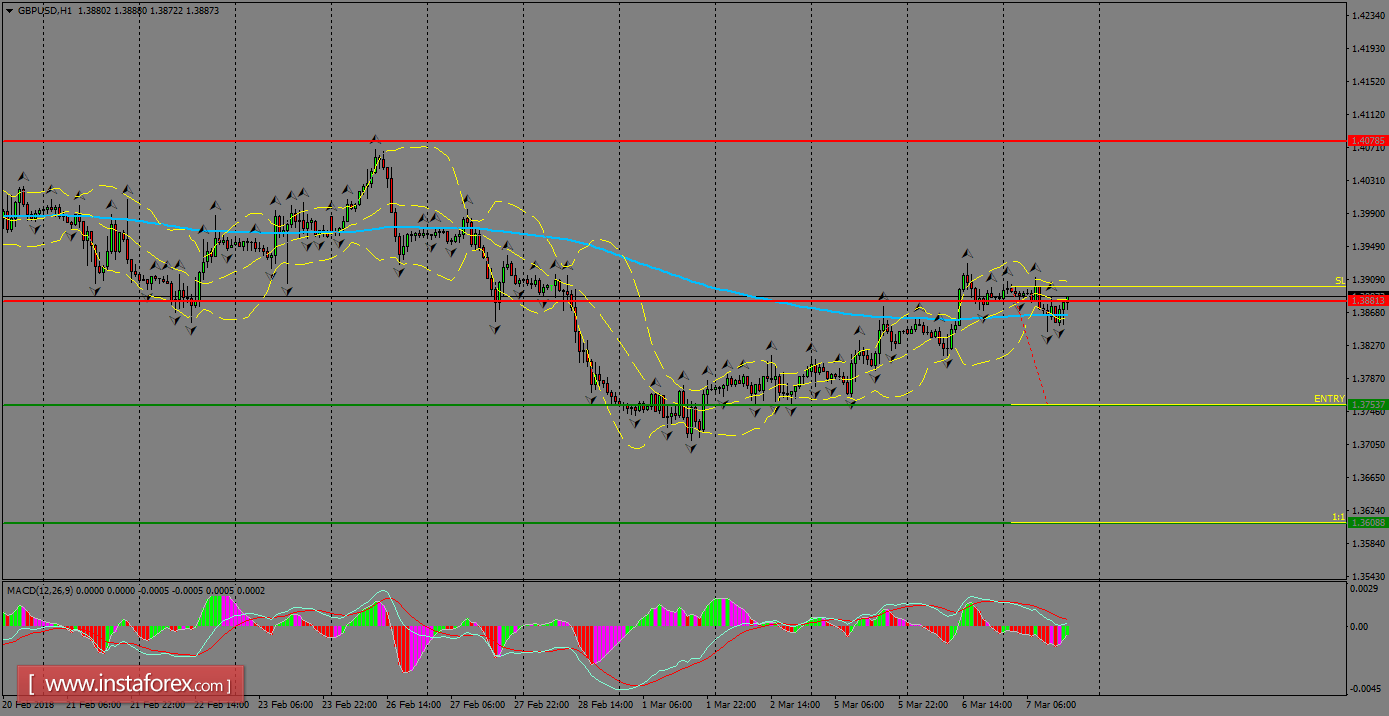
H1 chart's resistance levels: 1.3881 / 1.4078
H1 chart's support levels: 1.3753 / 1.3608
Trading recommendations for today: Based on the H1 chart, sell (short) orders only if the GBP/USD pair breaks a bearish candlestick; the resistance level is at 1.3753, take profit is at 1.3608 and stop loss is at 1.3901.


