Main Quotes Calendar Forum
flag

FX.co ★ Ichimoku cloud indicator analysis of USDX for March 8, 2018

parent
Forex Analysis:::2018-03-08T08:02:01

Ichimoku cloud indicator analysis of USDX for March 8, 2018

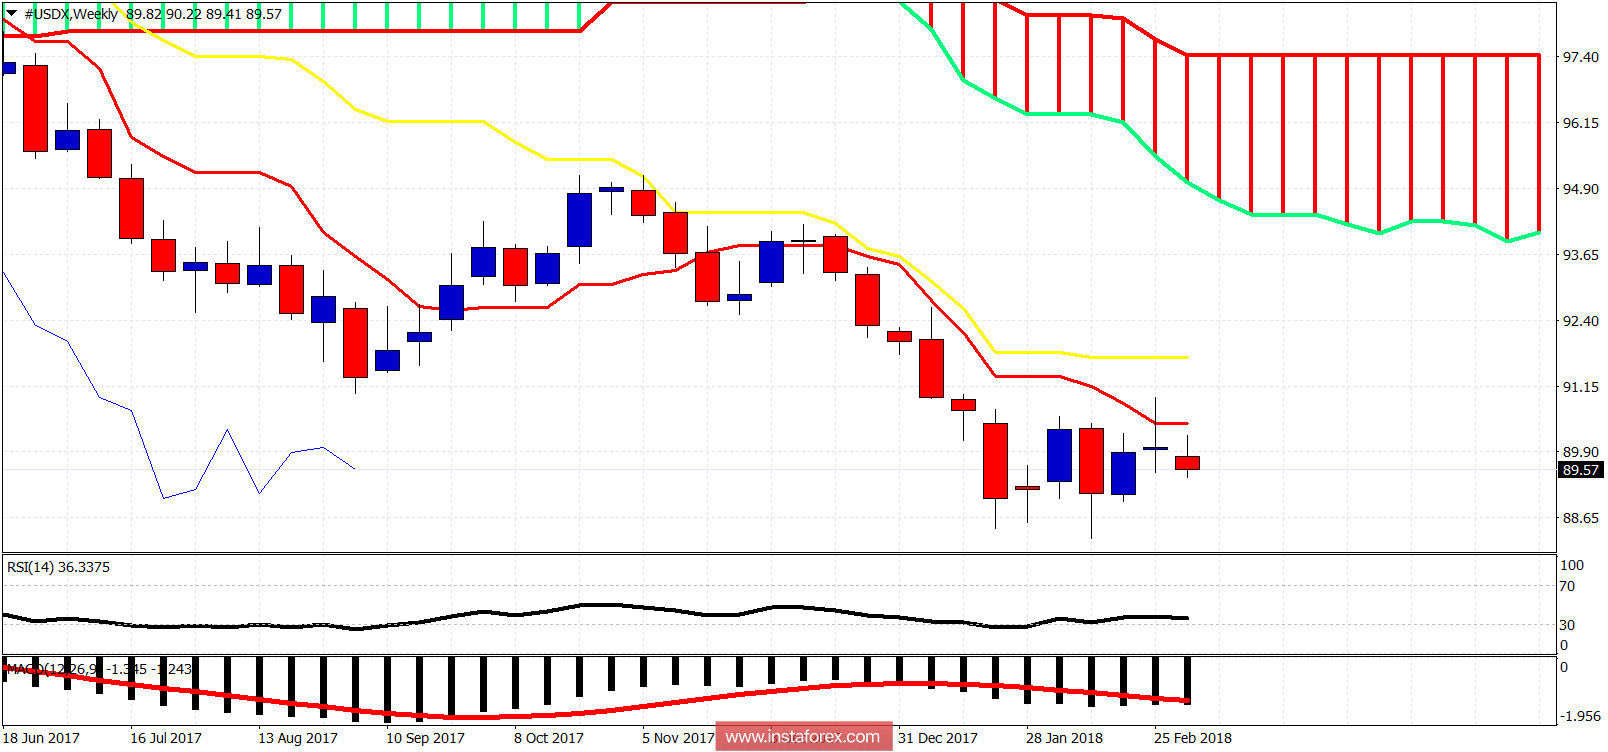
The Dollar index remains under pressure. Price has broken below the 4-hour Kumo and has turned short-term trend from neutral to bearish. Price continues to make lower lows and lower highs while trading below both the tenkan- and kijun-sen.

Ichimoku cloud indicator analysis of USDX for March 8, 2018

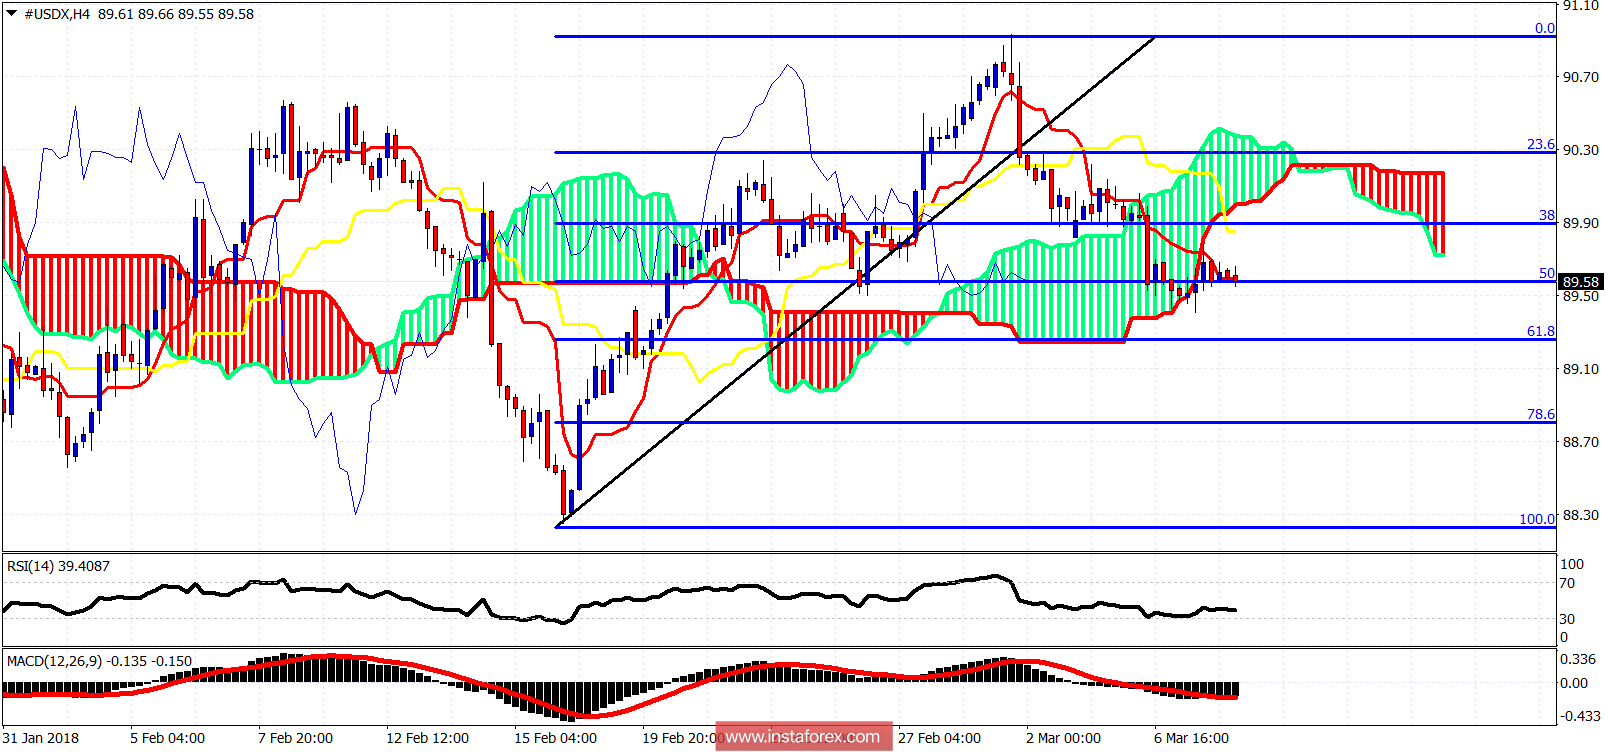
Next important short-term support is at 89.25 where we find the 61.8% Fibonacci retracement. As long as price is below the Kumo trend will be bearish. For trend to change to bullish in the 4hour chart we will need to see a break above 90.40. Price could bounce from the 61.8% Fibonacci retracement and move higher to test the cloud from below.

Ichimoku cloud indicator analysis of USDX for March 8, 2018

On a weekly basis price got rejected last week by the tenkan-sen (Red line indicator) and remains below it. Trend is clearly bearish in the weekly chart and there is no sign of a bounce or reversal as long as price closes below the tenkan- and kijun-sen indicators. A break above the kijun-sen (yellow line indicator) will open the way for a bounce at least towards the Kumo.
Analyst InstaForex
Share this article:
parent
loader...
all-was_read__icon
You have watched all the best publications
presently.
We are already looking for something interesting for you...
all-was_read__star
Recently published:
loader...
More recent publications...