


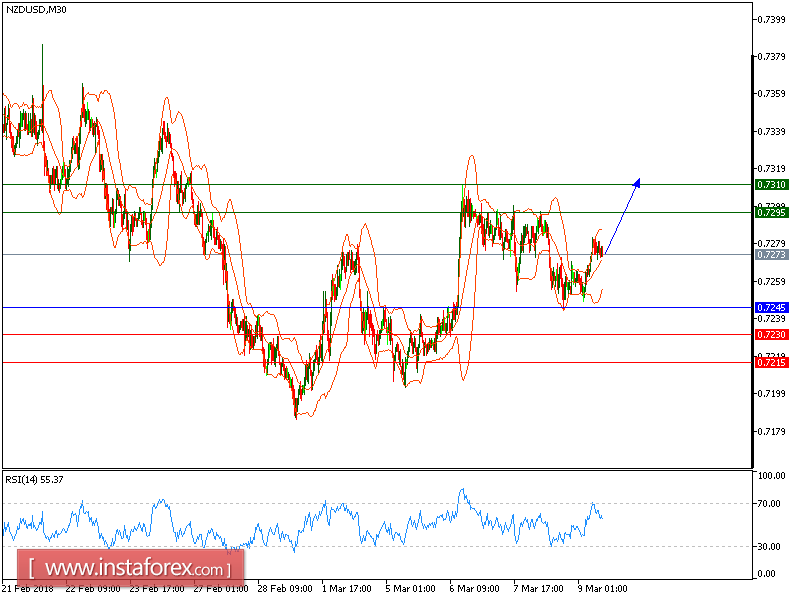
NZD/USD is expected to trade with bullish outlook. Although the pair posted a rebound and broke above its 20-period average, it is still capped by the upward 50-period moving average. The relative strength index is below its neutrality level at 50.
Hence, as long as 0.7245 is not surpassed, look for a further upside targets at 0.7295 and even to 0.7310 in extension.
The black line shows the pivot point. Currently, the price is above the pivot point which is a signal for long positions. If it remains below the pivot point, it will indicate short positions. The red lines show the support levels, while the green line indicates the resistance levels. These levels can be used to enter and exit trades.
Resistance levels: 0.7295, 0.7310, and 0.7345.
Support levels: 0.7230, 0.7215, and 0.7175.


