


The index is hovering around the 200 SMA on H1 chart and is looking forward to testing the resistance level of 90.63, as the sideways range remains in place. Such uncertainty is a clear indication that USDX could make a decisive move in the short term. If the 90.63 level gives up, then the next target would be the 91.75 level, while to the downside, the index could find support around 89.36.
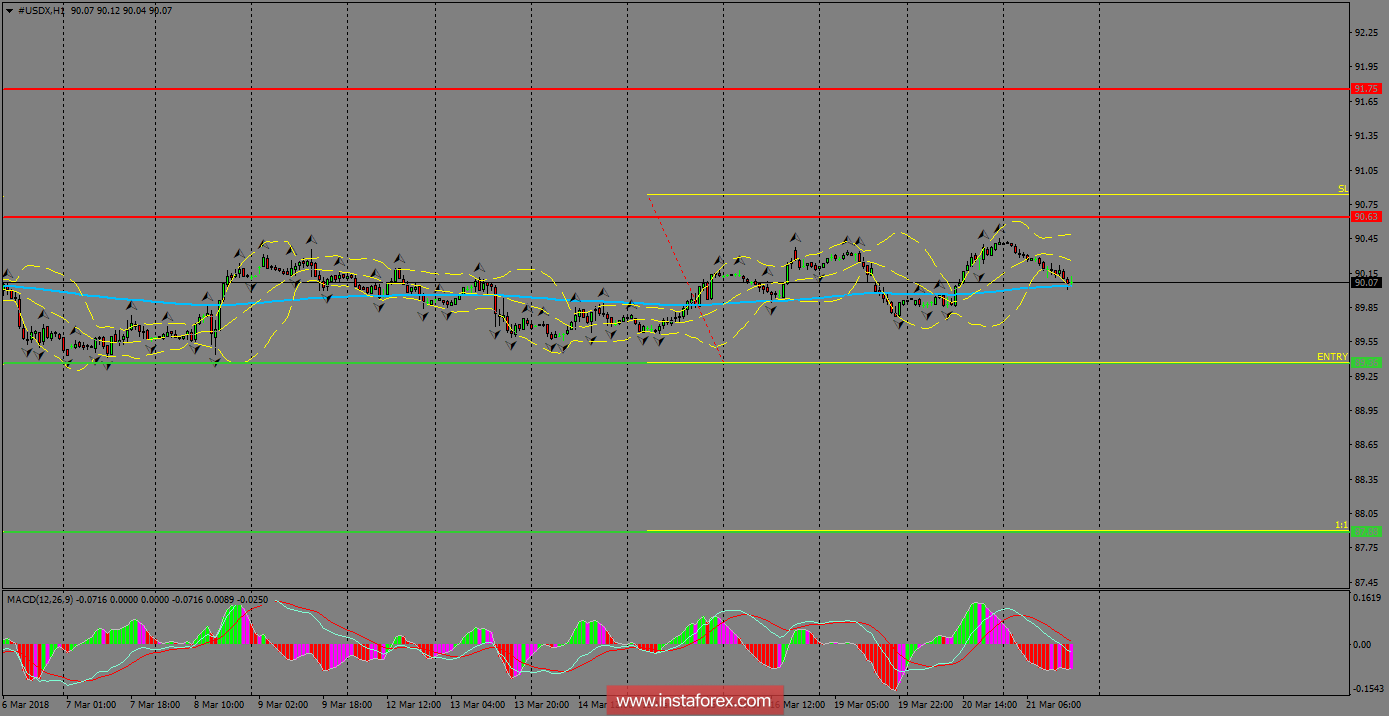
H1 chart's resistance levels: 90.63 / 91.75
H1 chart's support levels: 89.36 / 87.88
Trading recommendations for today: Based on the H1 chart, place sell (short) orders only if the USD Index breaks with a bearish candlestick; the support level is at 89.36, take profit is at 87.88 and stop loss is at 90.81.

