


USDX had a bearish journey during Wednesday's session and it looks like we can expect a breakout below the 200 SMA at H1 chart. The support zone of 89.36 could be the line in the sand for the rest of the week, as it's helping to contain declines across the board. To the upside, a strong resistance still lies at 90.63. MACD indicator still favors to the bears, as it stays in the negative territory.
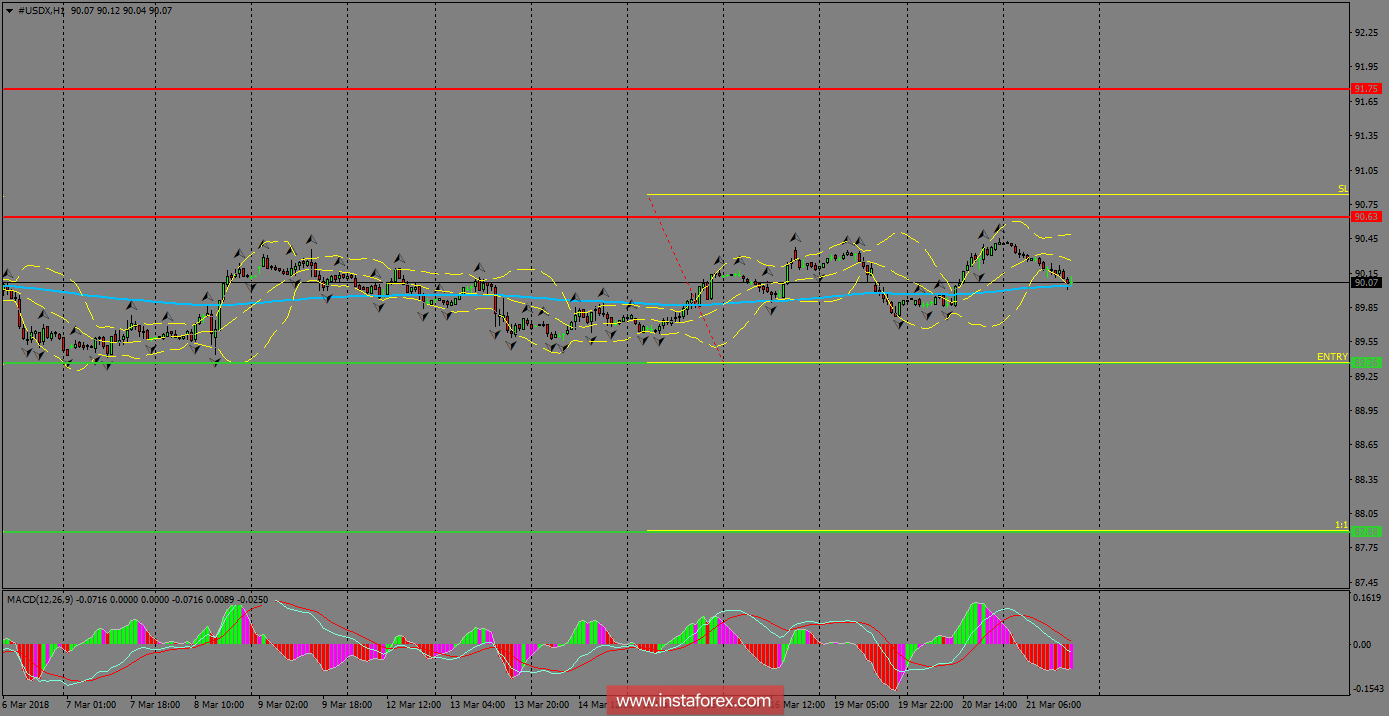
H1 chart's resistance levels: 90.63 / 91.75
H1 chart's support levels: 89.36 / 87.88
Trading recommendations for today: Based on the H1 chart, place sell (short) orders only if the USD Index breaks with a bearish candlestick; the support level is at 89.36, take profit is at 87.88, and stop loss is at 90.81.

