


The pair is trading within a bullish tone above the 200 SMA at the H1 chart and it's finding resistance in the 1.4134 level, at which formed a fractal that is allowing the current pullback. We can expect a lower continuation towards the support area of 1.4061, where a rebound should help the GBP/USD pair to resume the bullish bias. MACD indicator stays in the negative territory, favoring to the bears.
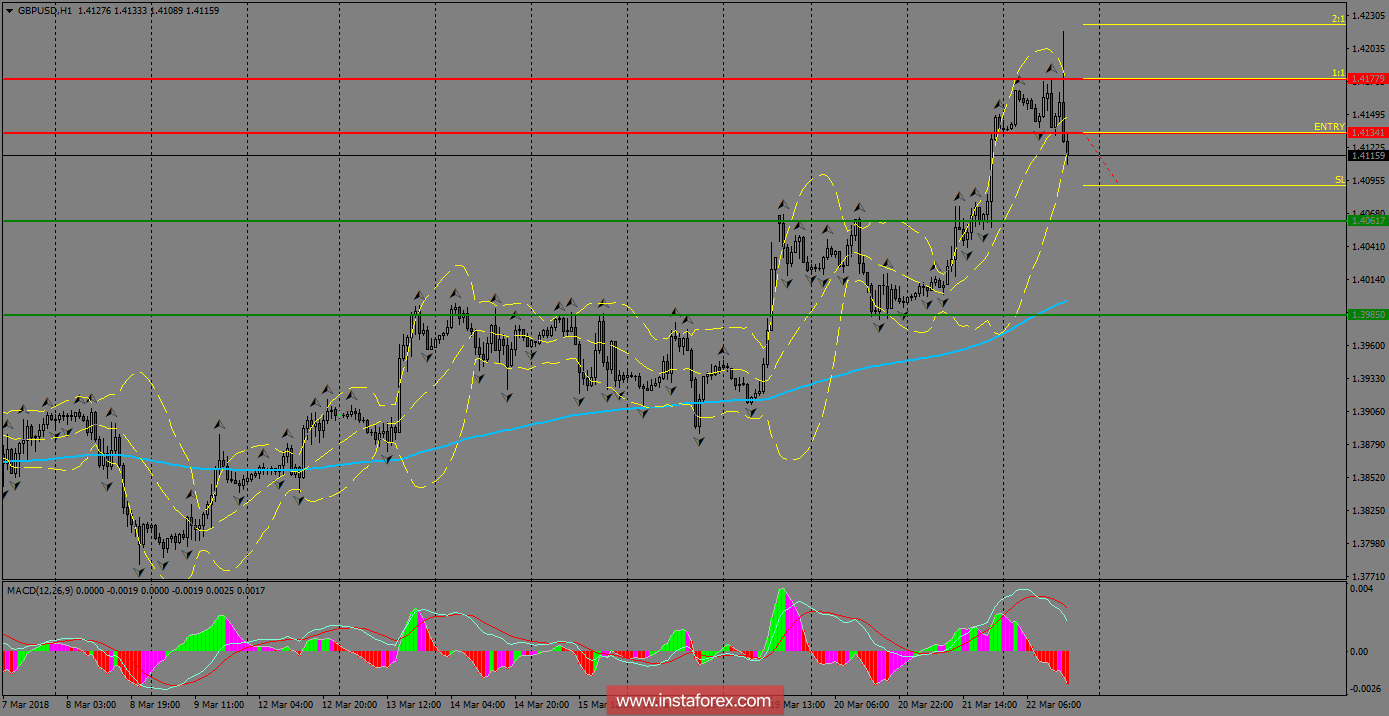
H1 chart's resistance levels: 1.4134 / 1.4177
H1 chart's support levels: 1.4061 / 1.3985
Trading recommendations for today: Based on the H1 chart, buy (long) orders only if the GBP/USD pair breaks a bullish candlestick; the resistance level is at 1.4134, take profit is at 1.4177 and stop loss is at 1.4090.

