


Overview:
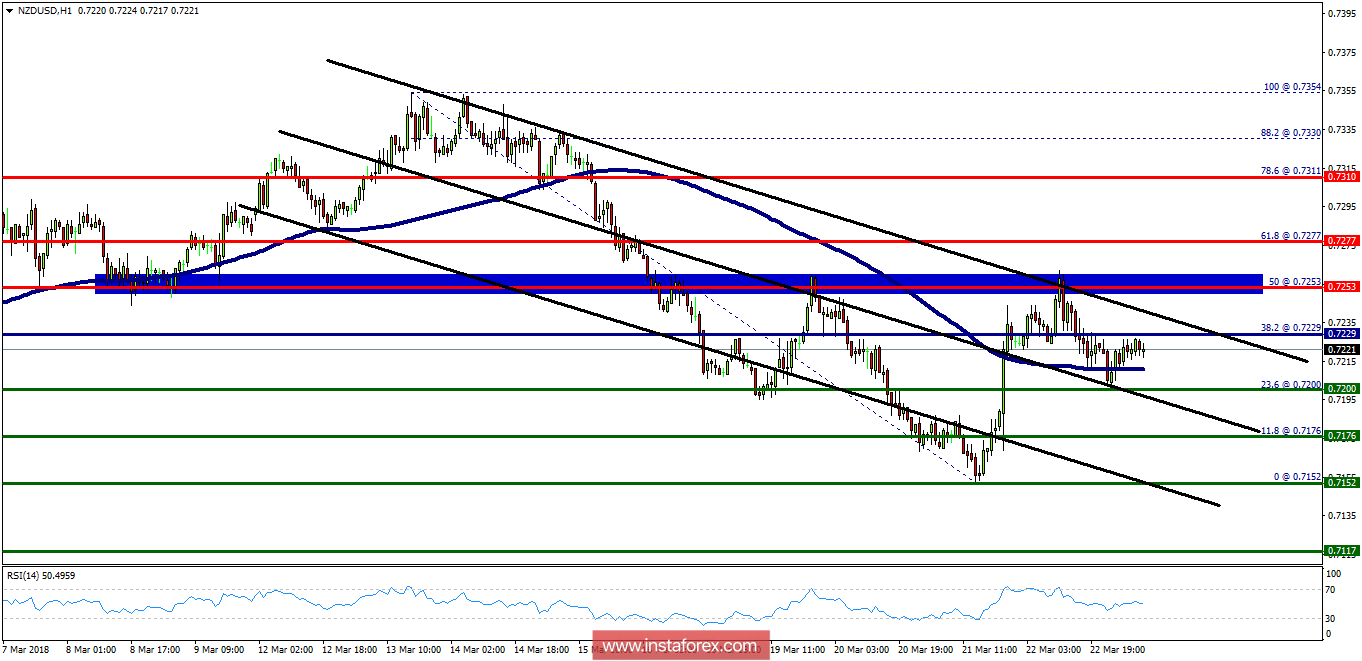
The NZD/USD pair has broken support at the level of 0.7253 which acts as a resistance. According to the previous events, the NZD/USD pair is still moving between the levels of 0.7253 and 0.7151. Therefore, we expect a range of 102 pips in the coming two days. The trend is still below the 100 EMA for that the bearish outlook remains the same as long as the 100 EMA is headed to the downside. Thus, the price area of 0.7253 remains a significant resistance zone. Consequently, there is a possibility that the NZD/USD pair will move downside. The structure of a fall does not look corrective. In order to indicate a bearish opportunity below 0.7253, sell below 0.7253 with the first targets at 0.7200 and 0.7152 in order to form a double bottom. Besides, the weekly support 1 is seen at the level of 0.7152. However, traders should watch for any sign of a bullish rejection that occurs around 0.7253, which is expected to act as a major resistance today. Since the trend is below the 50% Fibonacci level, the market is still in a downtrend. Overall, we still prefer the bearish scenario.


