


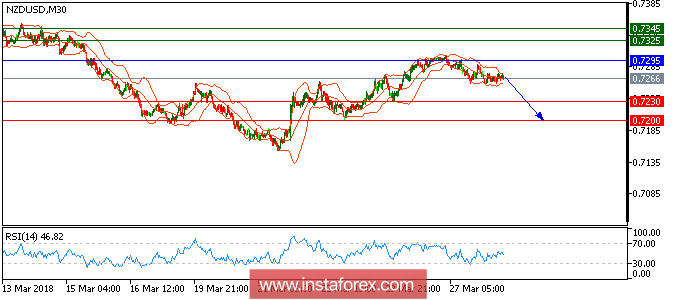
NZD/USD is under pressure and expected to trade in lower range. The pair remains capped by a declining trend line, and is likely to post a new pullback to 0.7230. The relative strength index is mixed to bearish below its neutrality area at 50. Both the 20-period and 50-period moving averages are turning down, and call for further decline. To conclude, as long as 0.7295 is not surpassed, look for a new pullback to 0.7230 and 0.7200 in extension.
Chart Explanation:
The black line shows the pivot point. Currently, the price is above the pivot point which is a signal for long positions. If it remains below the pivot point, it will indicate short positions. The red lines show the support levels, while the green line indicates the resistance levels. These levels can be used to enter and exit trades.
Resistance levels: 0.7325, 0.7345, and 0.7370.
Support levels: 0.7230, 0.7200, and 0.7160.


