


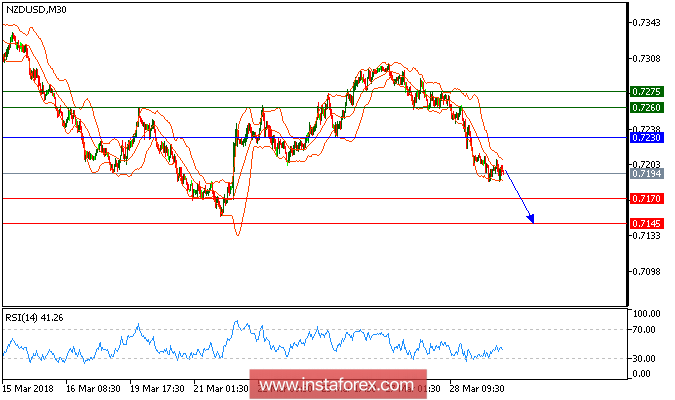
All our downside targets which we predicted in our previous analysis have been hit. NZD/USD is still under pressure and expected to trade in a lower range. The pair is heading downward now, capped by its falling 20-period and 50-period moving averages. The relative strength index is showing bearish momentum, and also remains below its descending trend line. In which case, the pair is likely to challenge its nearest key support at 0.7170. A break below 0.7170 would trigger a drop towards 0.7145.
Chart Explanation:
The black line shows the pivot point. Currently, the price is above the pivot point which is a signal for long positions. If it remains below the pivot point, it will indicate short positions. The red lines show the support levels, while the green line indicates the resistance levels. These levels can be used to enter and exit trades.
Resistance levels: 0.7260, 0.7275, and 0.7310.
Support levels: 0.7170, 0.7145, and 0.7105.


