


Gold price has found support in our target area of $1,320-30 and where the 4 hour Ichimoku cloud was found. The 61.8% Fibonacci retracement was also in that area. Gold is now bouncing as expected.
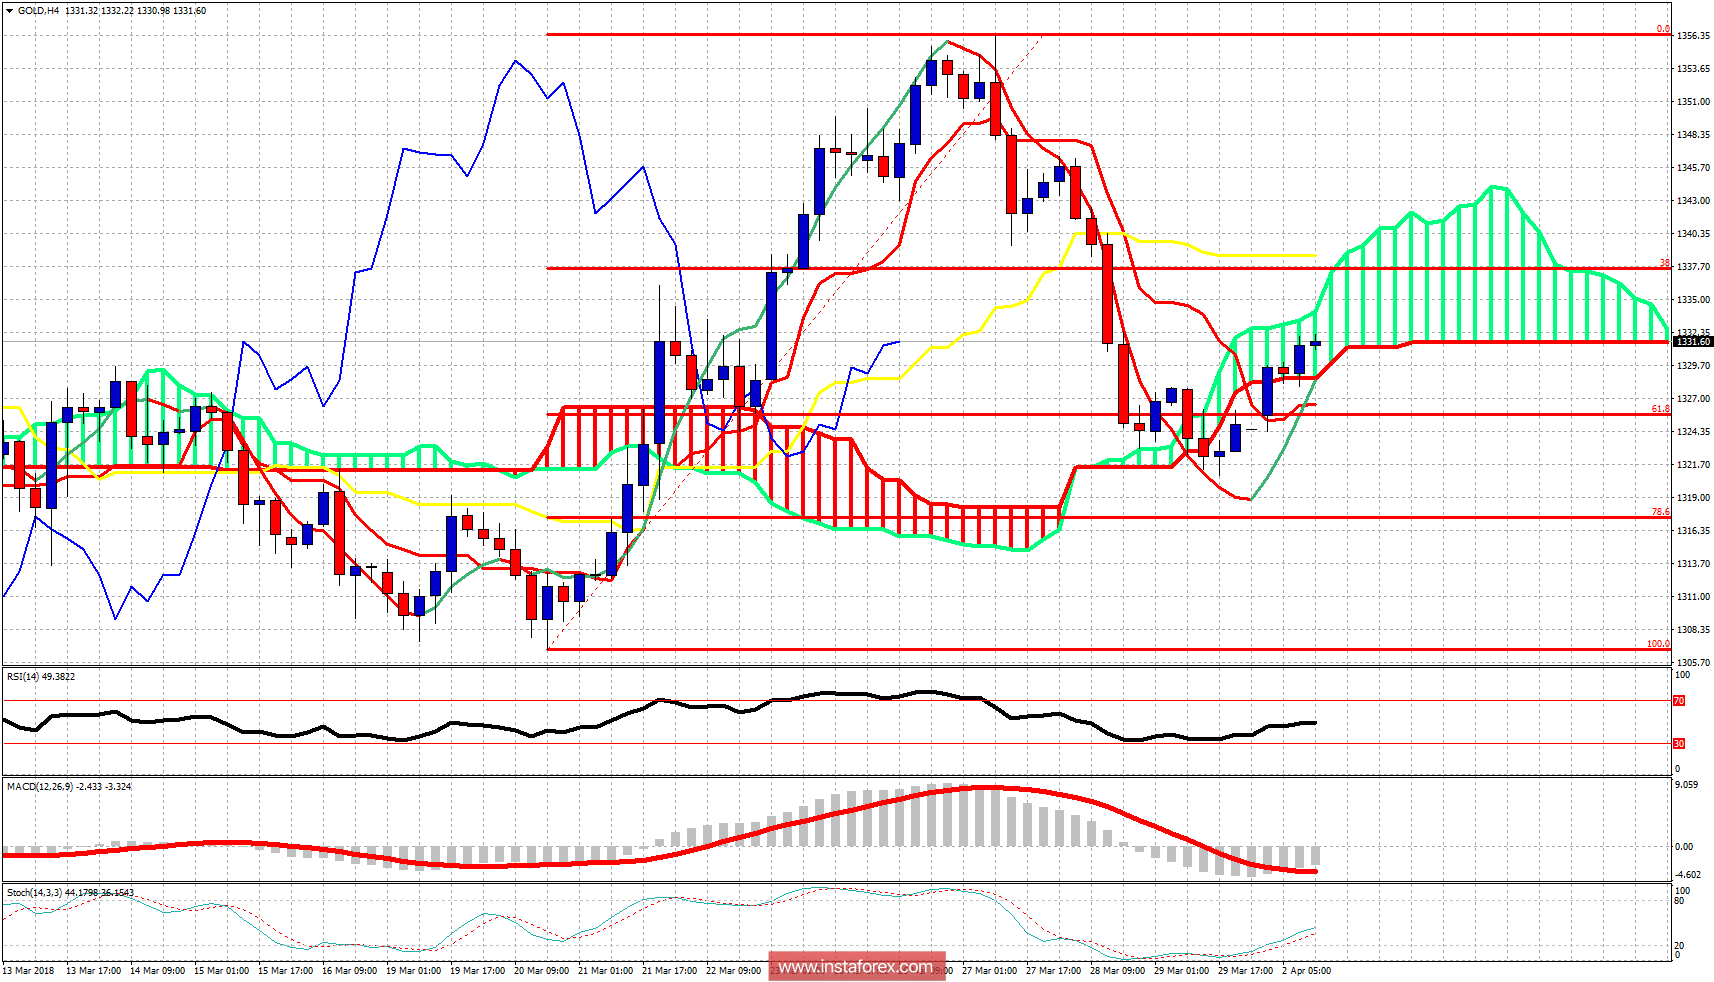
Gold price is trading inside the 4 hour Kumo. Resistance is at $1,334 and most importantly at $1,339. A break above the kijun-sen in the 4 hour chart will be a very important bullish sign. Gold price has support at $1,320. Bulls do not want to see the price below the cloud again and do not want to see the recent low broken. If this low is broken we should expect Gold price to reach $1,300 at least.
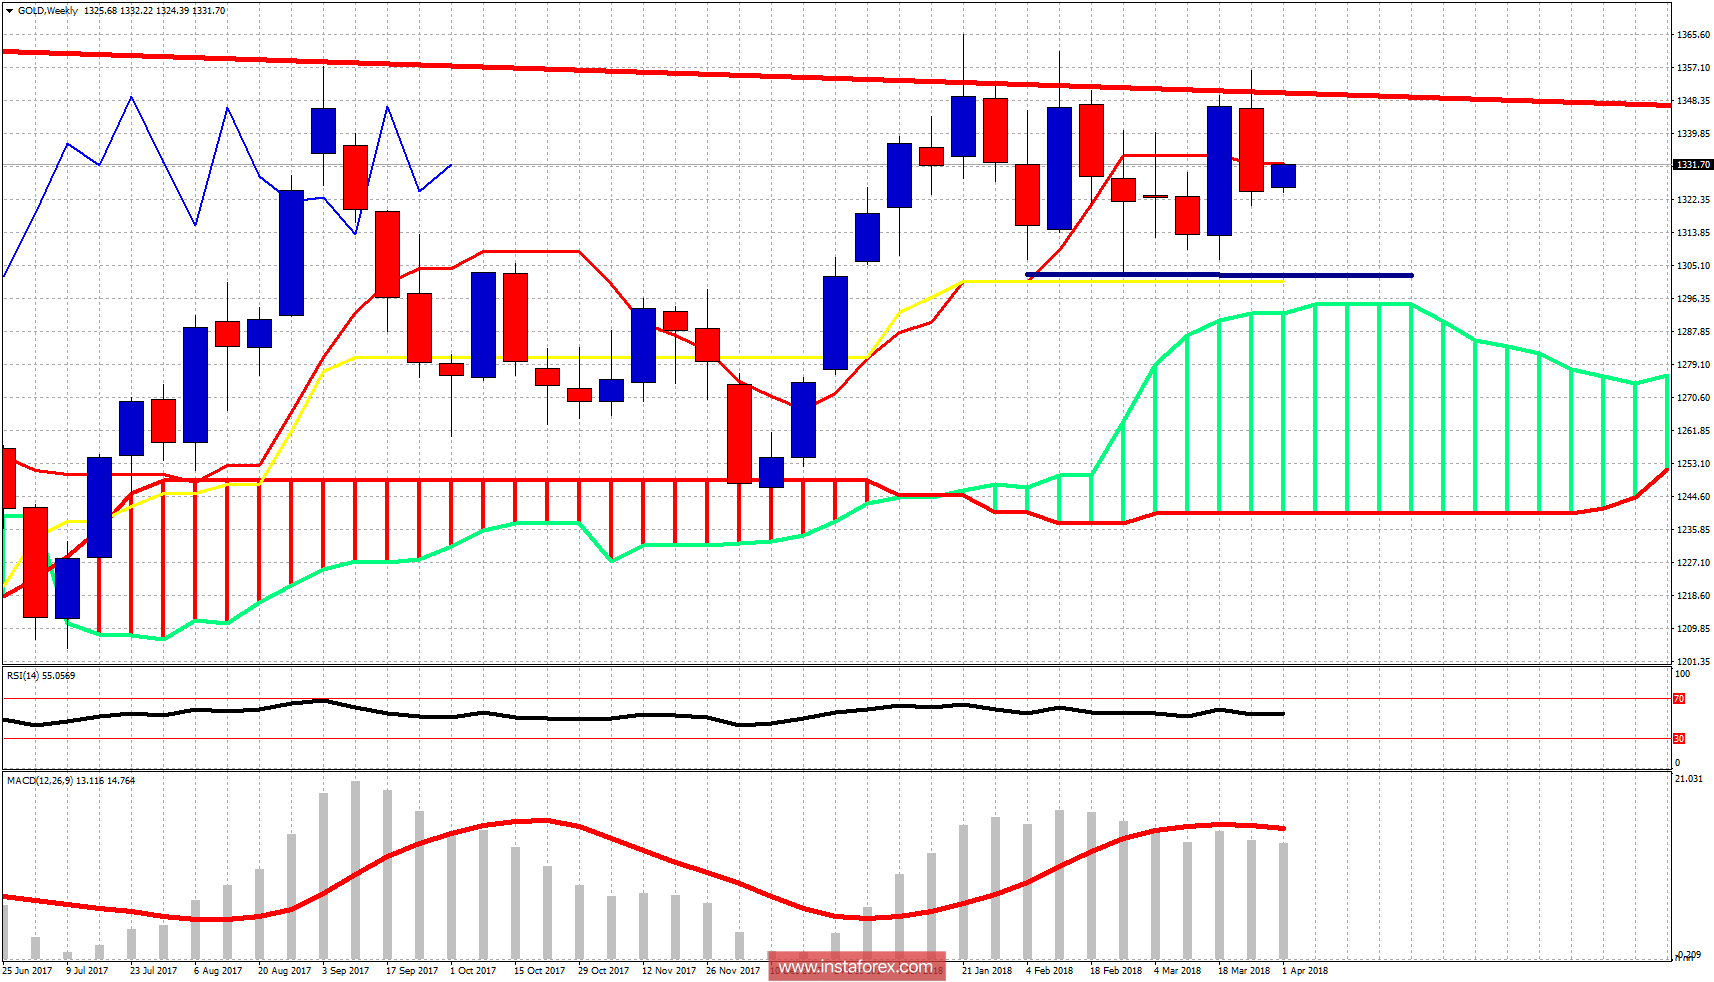
Red line -long-term resistance
Blue line -short-term support
Gold price has not managed to close above the red trend line resistance so far. Price has been mainly moving sideways the last few weeks in a trading range of $1,300-$1,350. If bulls manage to close a week above $1,350-60 we should then expect $1,400 to be challenged.


