


There is a battle between bulls and bears to drive the short-term path of USDX at the current stage, as the index is moving around the 200 SMA at H1 chart. Due to the overall weakness was seen in the structure, USDX could plummet to break below the 89.36 level, looking forward to reaching the 87.88 zone. MACD indicator stays in the negative territory, favoring to the bears.
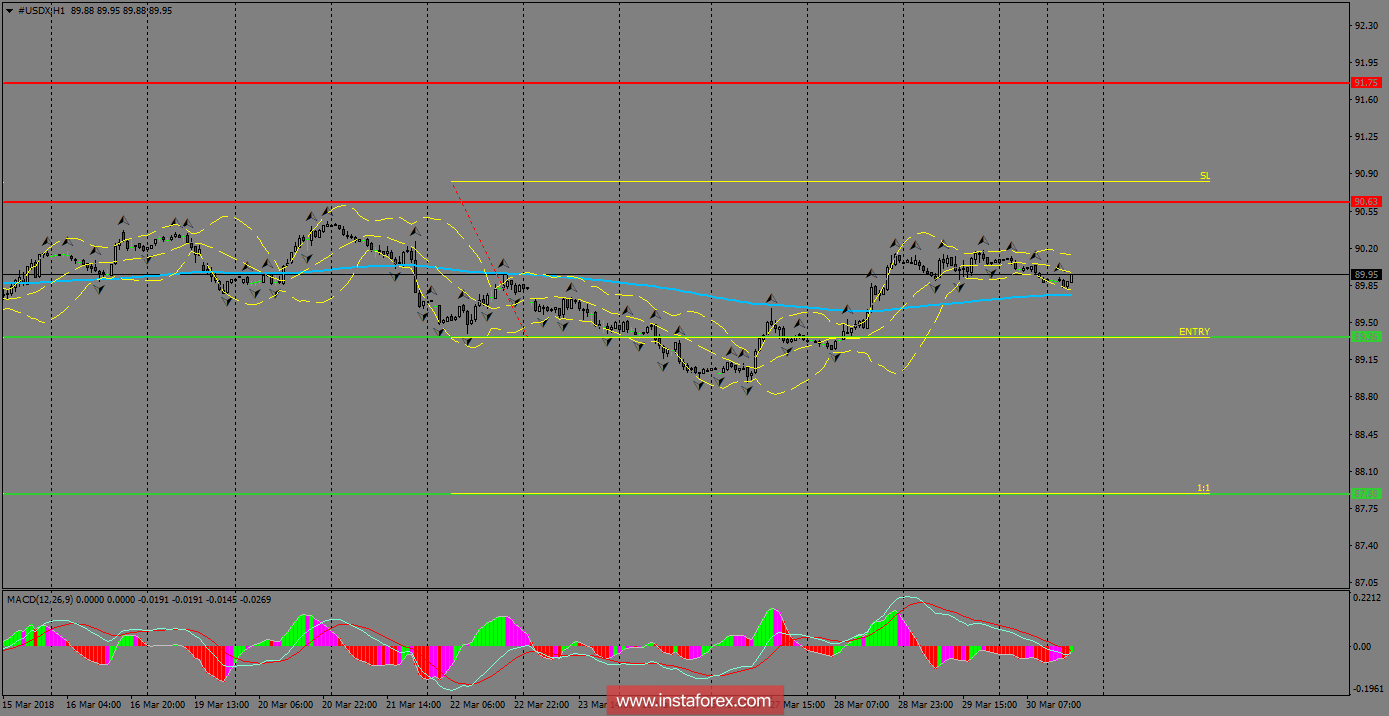
H1 chart's resistance levels: 90.63 / 91.75
H1 chart's support levels: 89.36 / 87.88
Trading recommendations for today: Based on the H1 chart, place sell (short) orders only if the USD Index breaks with a bearish candlestick; the support level is at 89.36, take profit is at 87.88 and stop loss is at 90.81.

