


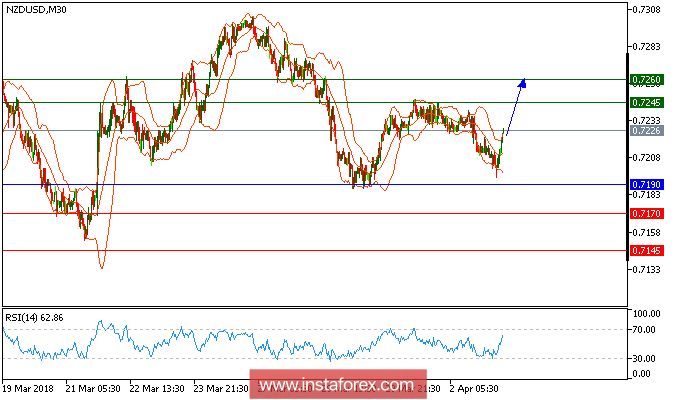
NZD/USD is expected to trade with a bullish outlook. The pair remains above its nearest key support at 0.7190. Both the 20-period and 50-period moving averages are turning up and call for further upside. Last but not least, the relative strength index is bullish above its neutrality area at 50. To conclude, as long as 0.7190 is not surpassed, likely reach 0.7245 and 0.7260 in extension.
Chart Explanation: The black line shows the pivot point. Currently, the price is above the pivot point which is a signal for long positions. If it remains below the pivot point, it will indicate short positions. The red lines show the support levels, while the green line indicates the resistance levels. These levels can be used to enter and exit trades.
Resistance levels: 0.7245, 0.7260, and 0.7285.
Support levels: 0.7170, 0.7145, and 0.7100.


