


The pair was offered in the 200 SMA at the H1 chart and still struggles to consolidate above that indicator. As the volume of trading starts to increase, we might expect some sideways moves across the board and the critical support level of 1.3985 could be challenged in the near-term. If a rebound happens at the current stage, then GBP/USD could re-test the resistance zone of 1.4166.
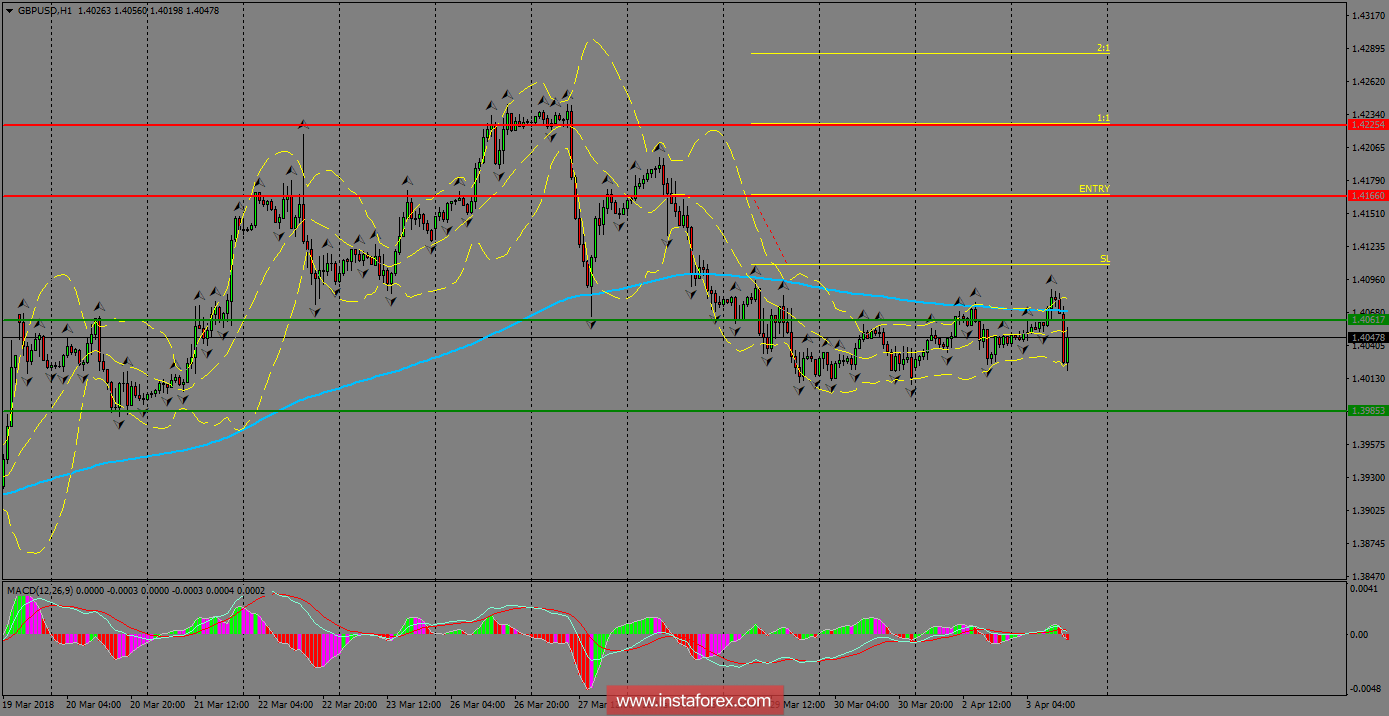
H1 chart's resistance levels: 1.4166 / 1.4225
H1 chart's support levels: 1.4061 / 1.3985
Trading recommendations for today: Based on the H1 chart, buy (long) orders only if the GBP/USD pair breaks a bullish candlestick; the resistance level is at 1.4166, take profit is at 1.4225 and stop loss is at 1.4108.

