


The pair is being hit by a selling wave across the board following a strong pressure in the 200 SMA at the H1 chart. Now, it seems like it can plummet towards the support zone of 1.3985, where buyers could appear in order to make a rebound to test the resistance level of 1.4166 and such move could resume the overall bullish bias.
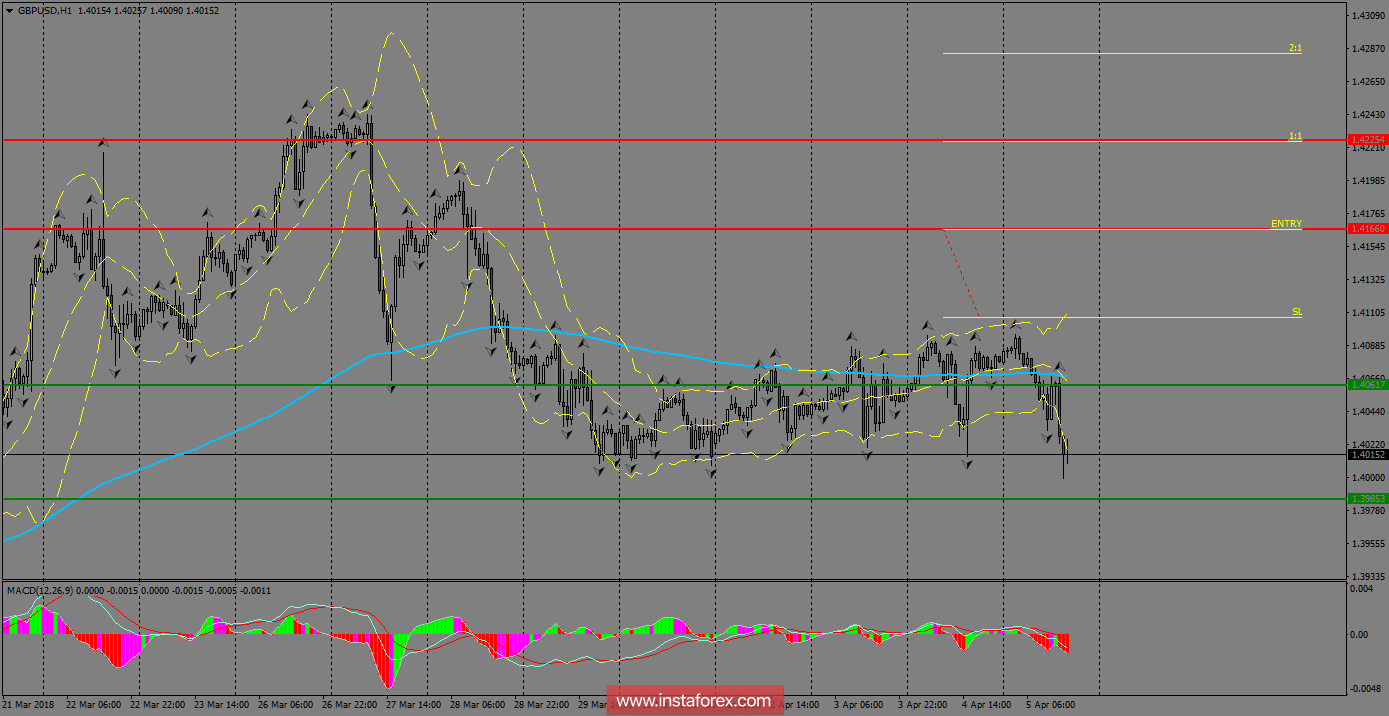
H1 chart's resistance levels: 1.4166 / 1.4225
H1 chart's support levels: 1.4061 / 1.3985
Trading recommendations for today: Based on the H1 chart, buy (long) orders only if the GBP/USD pair breaks a bullish candlestick; the resistance level is at 1.4166, take profit is at 1.4225 and stop loss is at 1.4108.

