


The index was capped by the 200 SMA at H1 chart and gains remain limited for the short-term. There's no a clear direction that could help to boost the greenback in some way, but eventually, USDX can perform a breakout below 89.36 in order to reach the 87.88 level, which is the first key target for sellers. MACD indicator is entering the negative territory, calling for further downside.
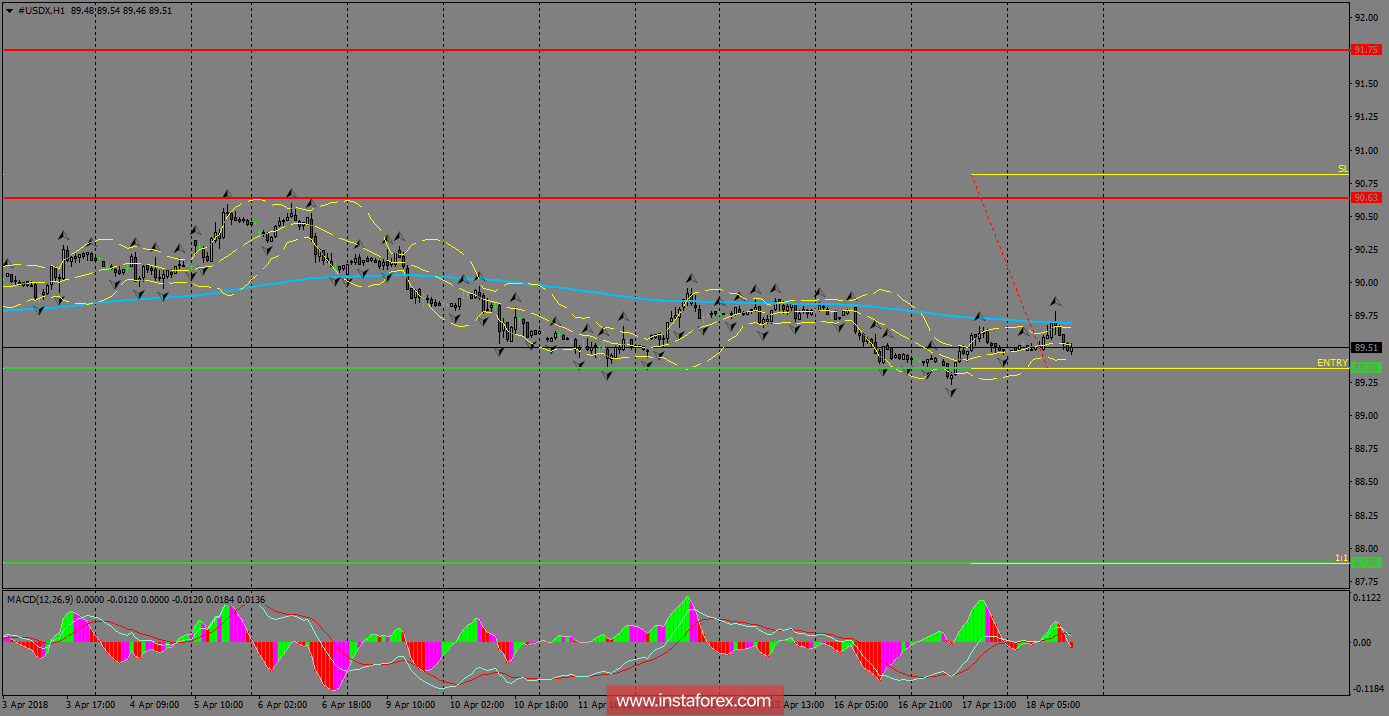
H1 chart's resistance levels: 90.63 / 91.75
H1 chart's support levels: 89.36 / 87.88
Trading recommendations for today: Based on the H1 chart, place sell (short) orders only if the USD Index breaks with a bearish candlestick; the support level is at 89.36, take profit is at 87.88 and stop loss is at 90.81.

