


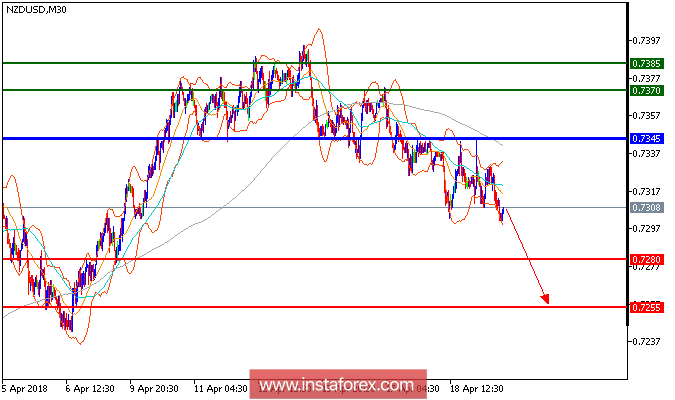
First downside target which we predicted in our previous analysis have been hit. NZD/USD is expected to trade with bearish outlook. The pair retreated after failing to challenge the key resistance at 0.7345, which should maintain the selling pressure. The relative strength index is mixed to bearish. As long as 0.7345 is not surpassed, look for a return to 0.7280. A break below this level would trigger a new drop to 0.7255.
Chart Explanation: The black line shows the pivot point. Currently, the price is above the pivot point, which is a signal for long positions. If it remains below the pivot point, it will indicate short positions. The red lines show the support levels, while the green line indicates the resistance levels. These levels can be used to enter and exit trades.
Resistance levels: 0.7370, 0.7385, and 0.7425
Support levels: 0.7280, 0.7255, and 0.7215.


