


GBP/USD managed to recover above the 200 SMA at H1 chart and it seems we could expect a rally to test the next resistance level at 1.4283. A break above it should expose the 1.4386 level, where the bears could appear on the scene once again to attempt a pullback. However, the bulls are still favoring to rally towards the 1.4386.
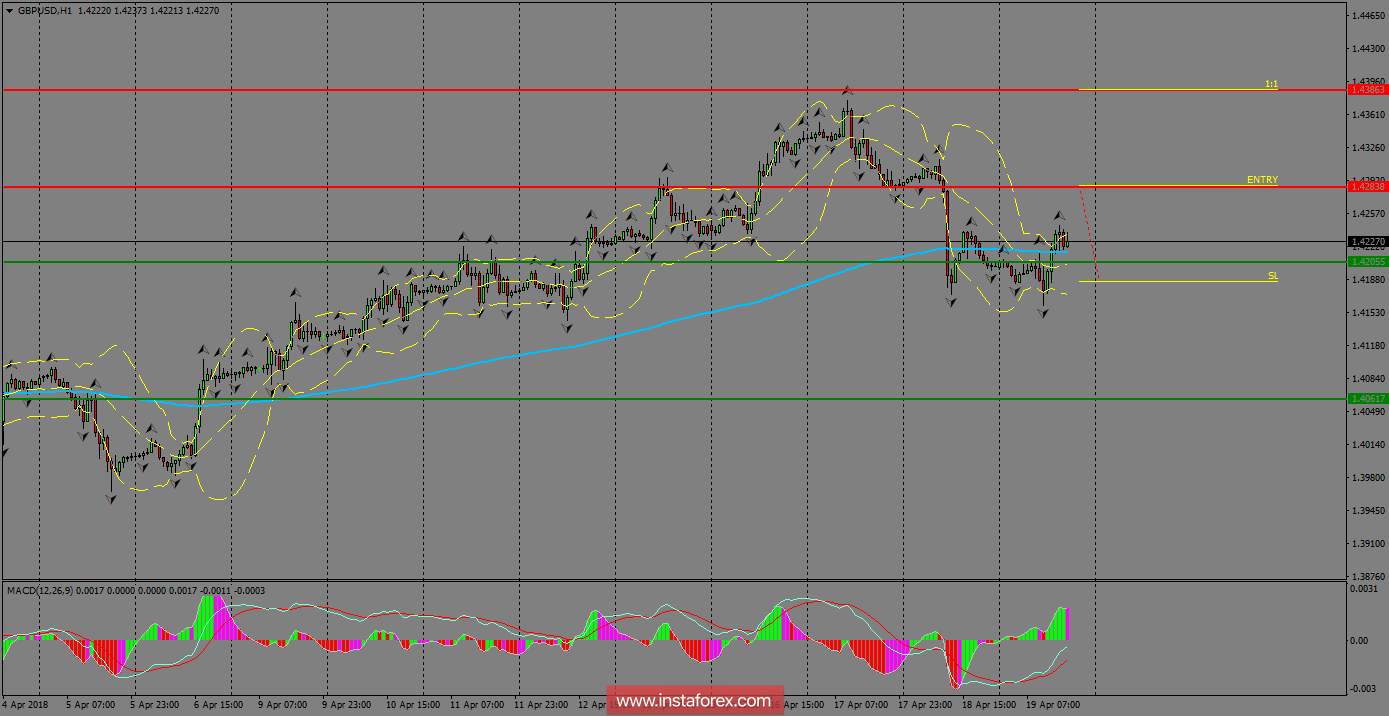
H1 chart's resistance levels: 1.4283 / 1.4386
H1 chart's support levels: 1.4205 / 1.4061
Trading recommendations for today: Based on the H1 chart, buy (long) orders only if the GBP/USD pair breaks a bullish candlestick; the resistance level is at 1.4283, take profit is at 1.4386 and stop loss is at 1.4183.

