


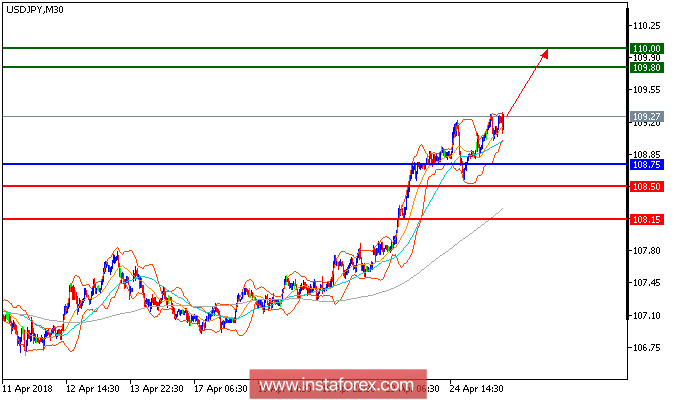
USD/JPY is expected to trade with bullish outlook. The pair is rebounding from 108.50 (the low of April 24) and is challenging both 20-period and 50-period moving averages. The relative strength index broke above the neutrality level at 50, calling for continuation of the bounce. Hence, as long as 108.75 is not broken, look for a re-test of 109.80. A break above this level would trigger a new rise to 110.
Chart Explanation: The black line shows the pivot point. The present price above the pivot point indicates a bullish position, and the price below the pivot point indicates a short position. The red lines show the support levels, and the green line indicates the resistance levels. These levels can be used to enter and exit trades.
Strategy: BUY, stop loss at 108.75, take profit at 109.80.
Resistance levels: 109.80, 110.00, and 110.35
Support levels: 108.50, 108.15, and 107.50.


