Technical outlook:
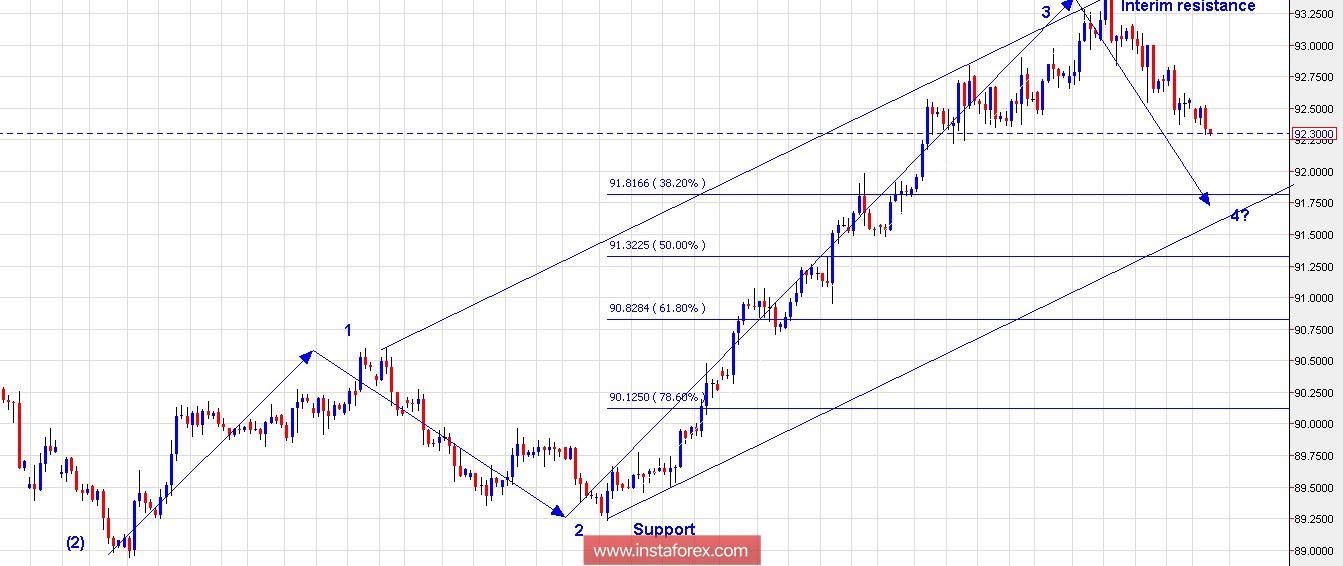
The US Dollar Index story continues to keep its rising trend intact, while it takes a momentary dip for now. After printing highs at 93.41 on May 09, 2014, the dollar index continues to consolidate its earlier gains, drifting lower towards a fibonacci 0.382 support at 91.80 levels and also a channel line support, that typically forms wave 4. According to the 4H chart displayed here, the index is expected to drop through 91.80 and channel line support around May 16, 2018. Looking into the wave counts, the US Dollar Index is progressing into wave (3) of a higher degree and within that wave (3), it is set to carve wave 4 of a lesser degree. Interim resistance stays at 93.41 levels for now, while support is seen through 91.80 levels to start with. If this wave structure holds true, prices would ideally stay above 90.50/60 levels before turning higher again.
Trading plan:
Remain long for now and look to add further around 91.80 levels, stop below 90.00, target 95.00 plus.
Fundamental outlook:
There are no major events lined up for the day.
Good luck!


