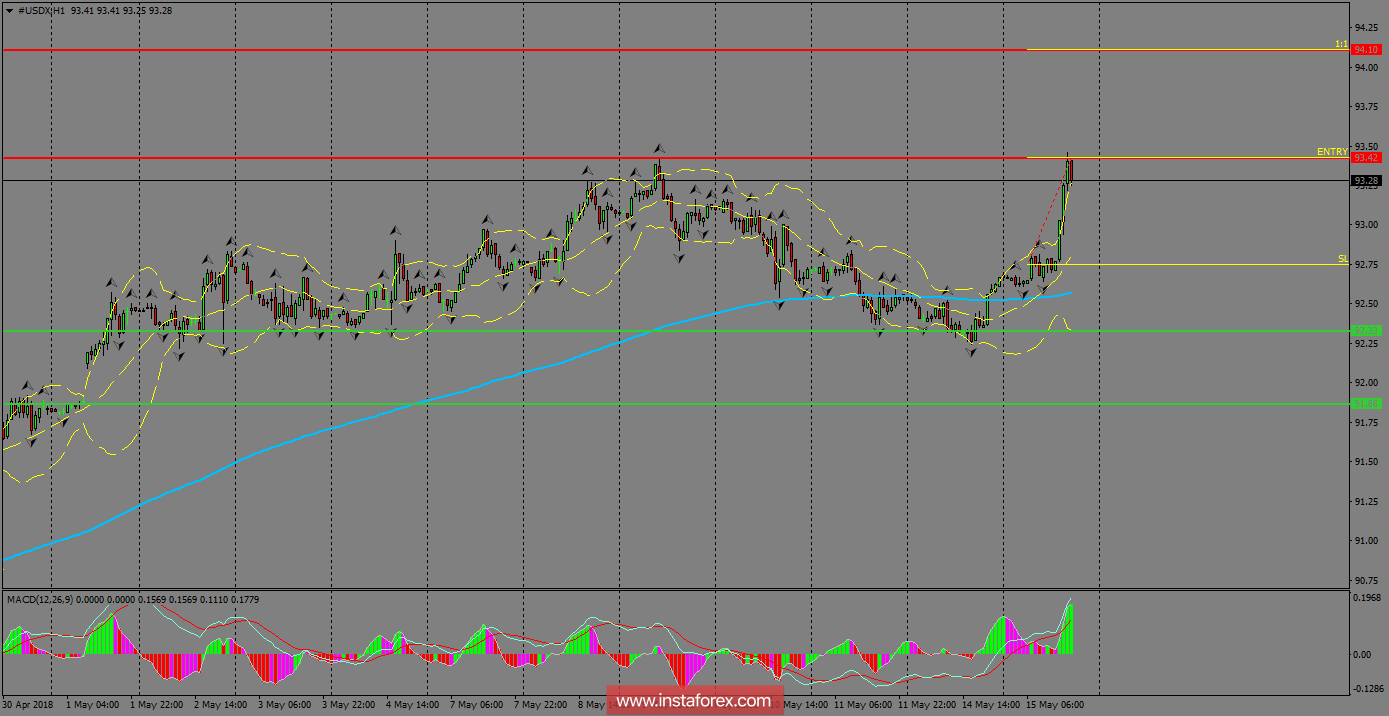
USDX was favored by the bulls during the last few hours following U.S. retail sales figures and it helped to push higher to the index above the 200 SMA at H1 chart. The resistance level of 93.42 is now being challenged and a break above it should open the doors for a testing of the 94.10 level. However, a pullback should be capped by the 200 SMA. MACD indicator stays in the positive territory, favoring to the bullish price action.

H1 chart's resistance levels: 93.42 / 94.10
H1 chart's support levels: 92.33 / 91.86
Trading recommendations for today: Based on the H1 chart, place buy (long) orders only if the USD Index breaks with a bearish candlestick; the support level is at 93.42, take profit is at 94.10 and stop loss is at 92.75.


