


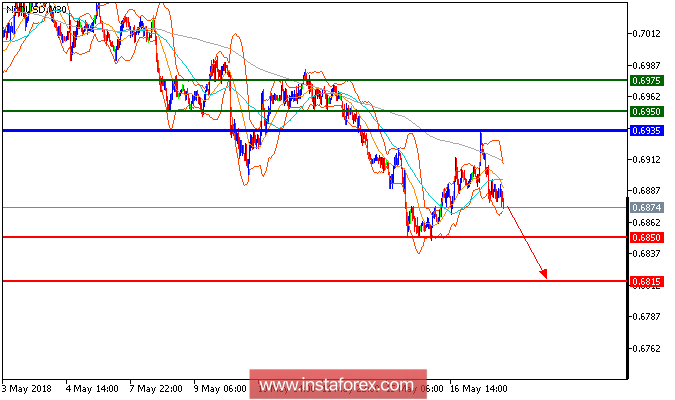
NZD/USD is expected to trade with a bearish outlook. The pair retreated from 0.6935 and broke below the lower boundary of bollinger bands, indicating the potential of downward acceleration. The declining trend line, which emerged, should push the prices lower. The relative strength index has broken down its oversold level of 30. Therefore, as long as 0.6935 is not surpassed, look for a further decline with targets at 0.6850 and 0.6815 in extension.
Chart Explanation: The black line shows the pivot point. Currently, the price is above the pivot point which is a signal for long positions. If it remains below the pivot point, it will indicate short positions. The red lines show the support levels, while the green line indicates the resistance levels. These levels can be used to enter and exit trades.
Resistance levels: 0.6950, 0.6975, and 0.7010
Support levels: 0.6850, 0.6815, and 0.6775


