


The bulls are gathering strength in the short term. It looks like we can expect further gains above the resistance level of 93.42 in order to reach the next key target placed at 94.10. The 200 SMA is pointing upwards and it's favoring the bullish price action. However, a pullback should take it to test the mentioned moving average.
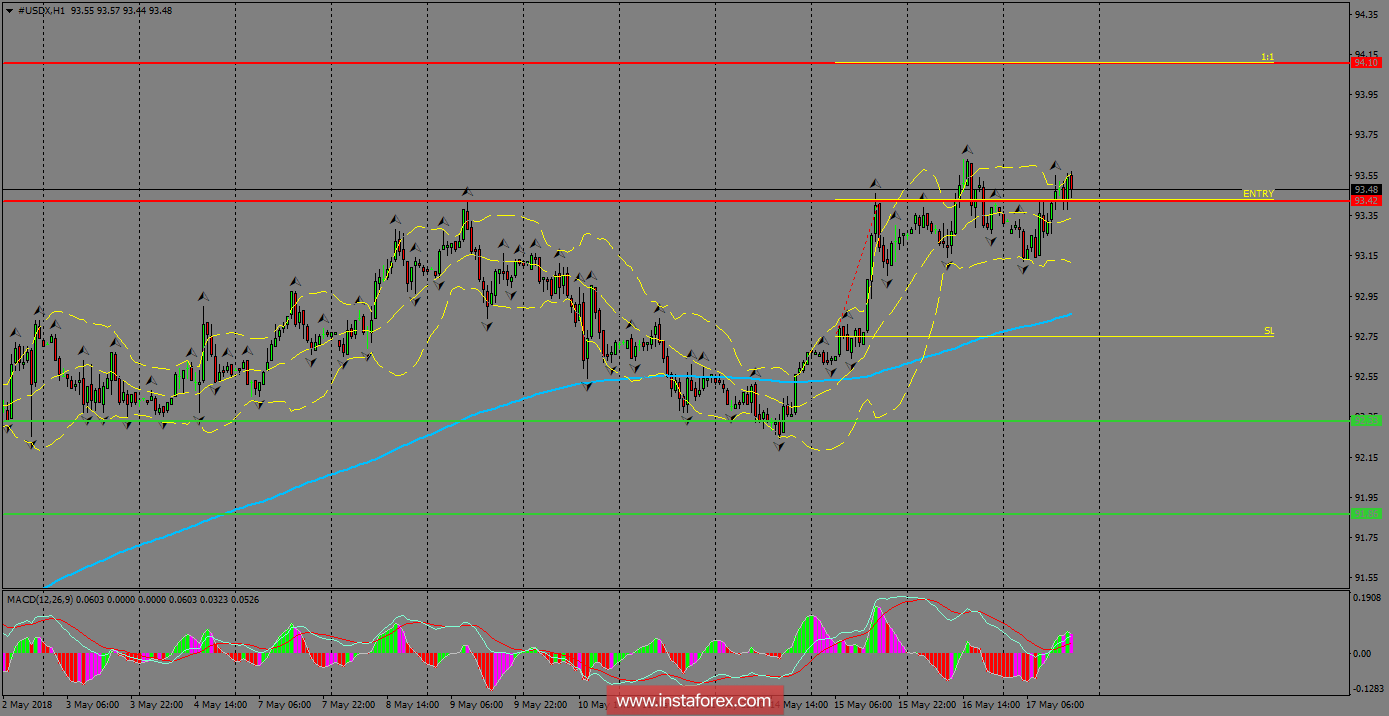
H1 chart's resistance levels: 93.42 / 94.10
H1 chart's support levels: 92.33 / 91.86
Trading recommendations for today: Based on the H1 chart, place buy (long) orders only if the USD Index breaks with a bearish candlestick; the support level is at 93.42, take profit is at 94.10 and stop loss is at 92.75.

