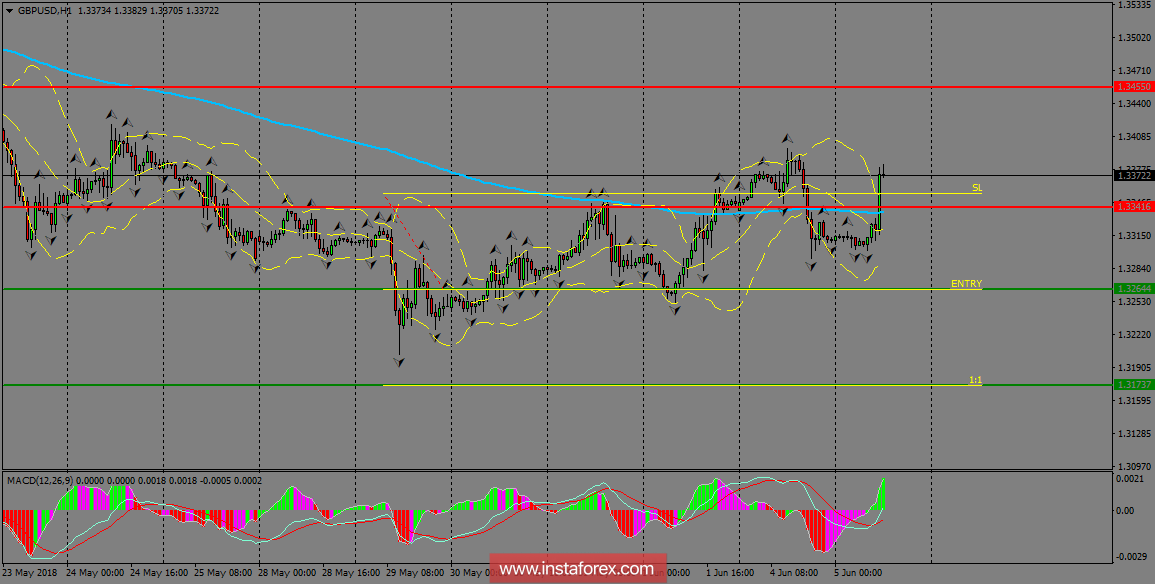
The pair is having a bullish momentum above the 200 SMA at H1 chart following a fresh buying wave seen in the GBP across the board. With that move, dos are opening for test the resistance zone of 1.3455.However, the risk to the downside still prevails and then we can expect further declines toward the support zone of 1.3264.

H1 chart's resistance levels: 1.3341 / 1.3455
H1 chart's support levels: 1.3264 / 1.3173
Trading recommendations for today: Based on the H1 chart, sell (short) orders only if the GBP/USD pair breaks a bullish candlestick; the resistance level is at 1.3264, take profit is at 1.3173 and stop loss is at 1.3354.


