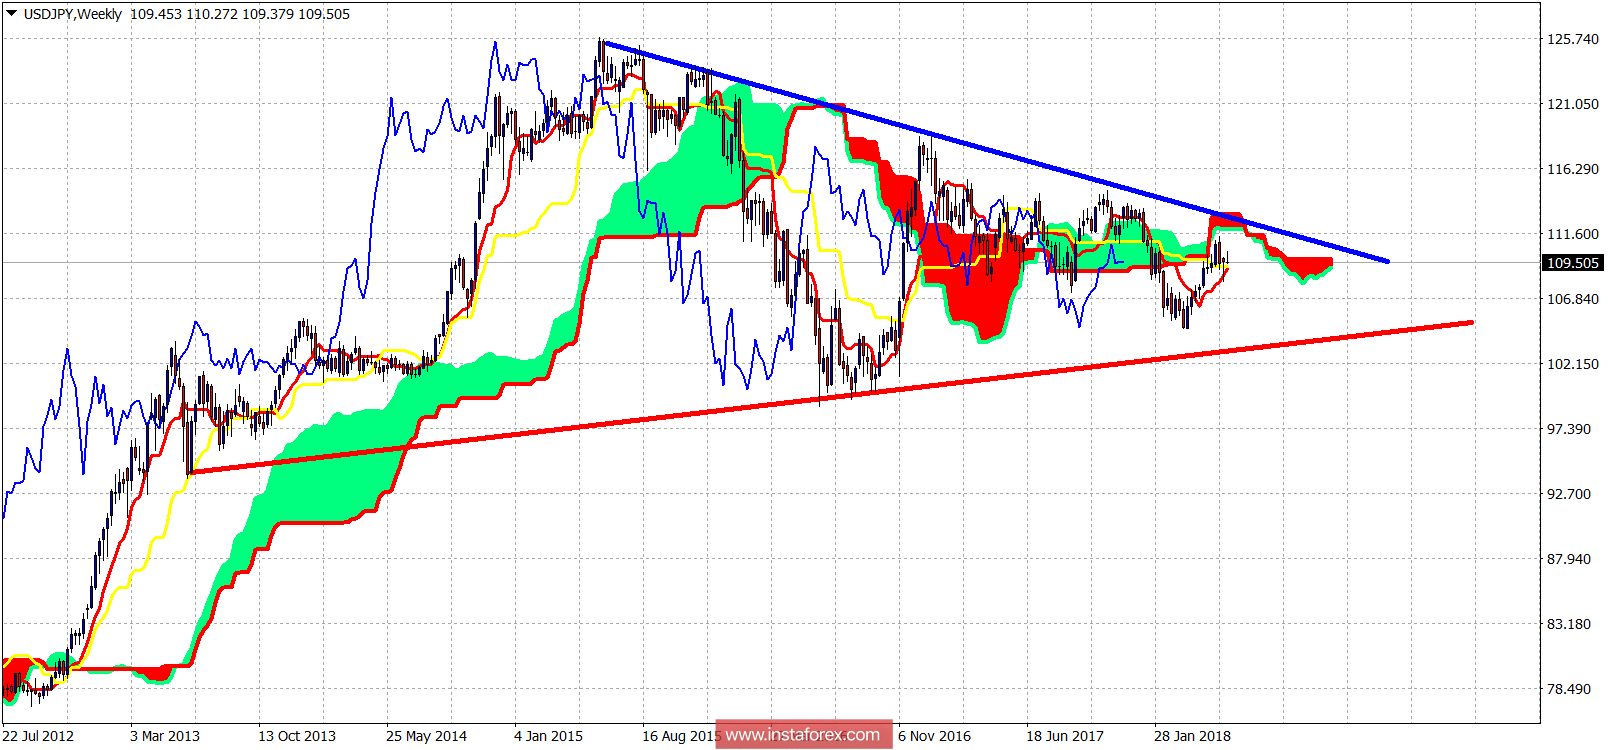
The USD/JPY pair is vulnerable to a new move lower towards 104. The price came very close to the weekly resistance levels and got rejected. There is a chance we might see 110.50, but a break below 109 will most probably cancel this possibility.

Blue line - long-term resistance
Red line -long-term support
The USD/JPY pair reached 110.20 earlier this week which is just above the 61.8% Fibonacci retracement of the decline from 111.40. The price reversed strongly below 110 soon after it and is now challenging the short-term support at 109.40. The weekly trend is bearish as the price is below the weekly Kumo resistance at 111.95. A weekly close below 109.40-109.20 will be a very bearish signal for next week. Overall, I expect the price to continue making lower lows and lower highs and eventually move towards the long-term red trend line support.


