Main Quotes Calendar Forum
flag

FX.co ★ Technical Analysis of Intraday Price Movements of Nasdaq 100 Index, Thusday February 02, 2023

parent
Forex Analysis:::2023-02-02T09:12:02

Technical Analysis of Intraday Price Movements of Nasdaq 100 Index, Thusday February 02, 2023

 Technical Analysis of Intraday Price Movements of Nasdaq 100 Index, Thusday February 02, 2023

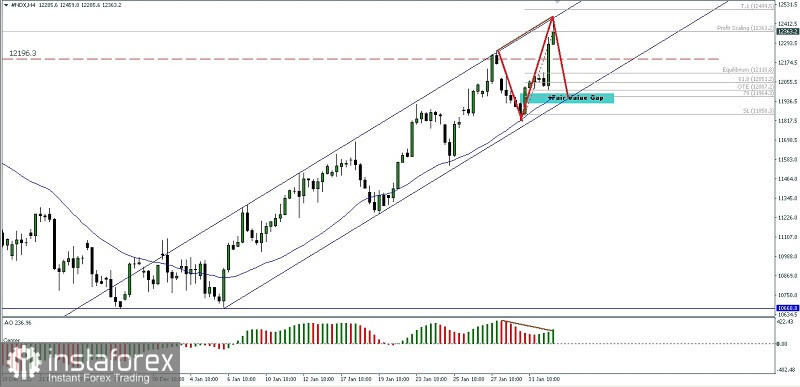
If we look at the 4-hour chart for the Nasdaq 100 index, it is clear that there is a deviation between the index's price movement and the Awesome Oscillator indicator, although currently #NDX is moving harmoniously in a channel that is swooping upward (Bull) but by successfully breaking Old High 12248.0 then # NDX has the potential to be corrected down to the level of 11964.3 before returning to its initial bias as long as the downward correction does not exceed the 11852.2 level then #NDX is still in a bull condition and has the potential to rally again.

(Disclaimer)

Analyst InstaForex
Share this article:
parent
loader...
all-was_read__icon
You have watched all the best publications
presently.
We are already looking for something interesting for you...
all-was_read__star
Recently published:
loader...
More recent publications...