On Tuesday, Wall Street only worked until the middle of the day and this is always before Independence Day celebration. The activity of traders during such a session is always limited, and the session has no significant meaning.
However, the beginning of the first half of the year, waiting for the season of quarterly companies' results (will start next week) and good atmosphere prevailing on European markets had to help bulls. One could only be afraid that a tweet would break the mood, but apparently, the president of the United States was already celebrating and did not emit any shocking news.
There were quite important macro reports on Tuesday (orders for durable goods and orders in the industry in May). Orders for durable goods in May fell by 0.4% (versus 0.6% expected ), and orders without means of transport did not change in value (0.3% expected). Industrial orders in May increased by 0.4% (it was expected that they will not change).
It seemed that the bears were in a lost position, but it was the problems on the front of the trade war that hurt the bull camp. The indexes started the day with increases, but after two hours they began to fall. The immediate reason was that the Chinese court temporarily banned the sale of Micron Technology in China.
If Donald Trump's aspiration to ban China Mobile in the US is added to this, the sell-off of shares in the high technology sector is easy to explain. No wonder NASDAQ lost 0.86% by pulling down the SP500 index - this lost 0.49%. This is not as easy as the beginning of the first half of the year.
Today, in the absence of Americans, indices may theoretically grow, but yesterday's session in the US will rather scare off European stock exchanges. This should, unless there is any new information, lead to a boring day that should end near neutral levels on major stock exchanges.
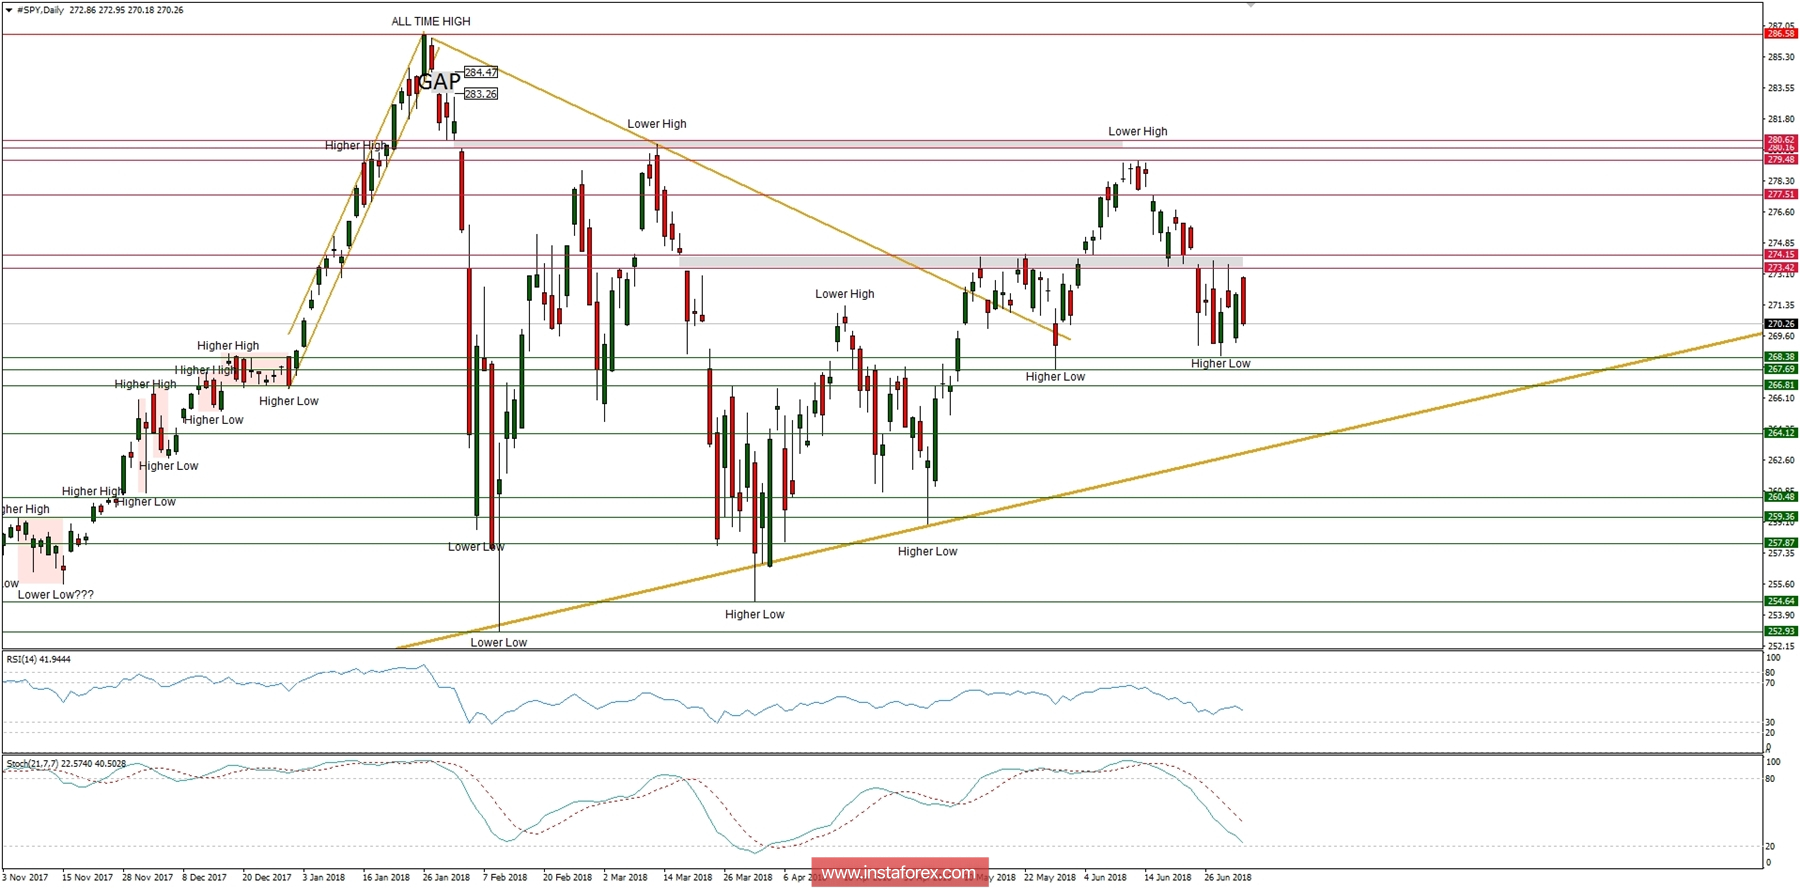
Let's now take a look at the SP500 technical picture at the H4 time frame. The market is clearly locked in a horizontal consolidation zone between the levels of 268.38 - 274.15 and might be forming the right shoulder of the Head and Shoulders technical pattern. This would indicate a possible drop in price to the level of 260.48 (technical support) soon. The weak momentum and stochastic oscillator support this bearish outlook.


