


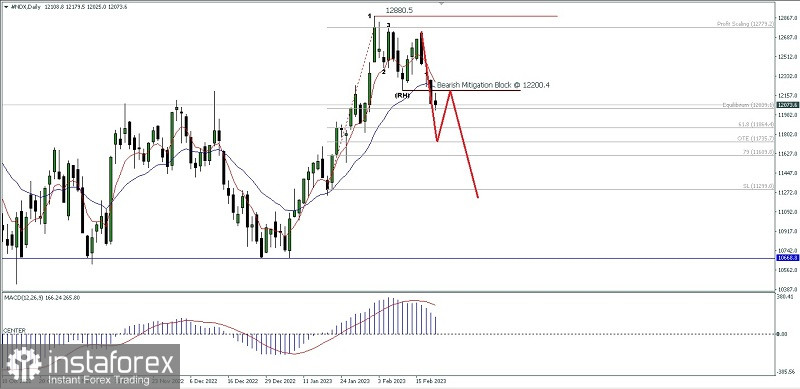
Nasdaq 100 Index on the daily chart seems to be showing the Bearish 123 pattern followed by Ross Hook that managed to be broken. However in a few days ahead there will be upside correction to test the level of 12200,4 if this level become a Resistance level which is strong enough to hold the correction rate #NDX then this index will return downward to test the level 1864,4 as the main target and the 11299,0 level as the next target if the volatility and momentum also supports and if on the way to the targets of these levels there is no upward correction which exceeds the level of 12383.6 because if this level is successfully penetrated above then all the Bearish scenarios previously described will become invalid and cancel automatically.
(Disclaimer)


