


The EUR/USD got rejected last week at the daily cloud resistance and pushed lower towards 1.16. Friday's daily candle was a bullish reversal hammer candlestick pattern. If prices continue higher this week we could have a couple of weeks with EURUSD strength that could push the price to 1.19.
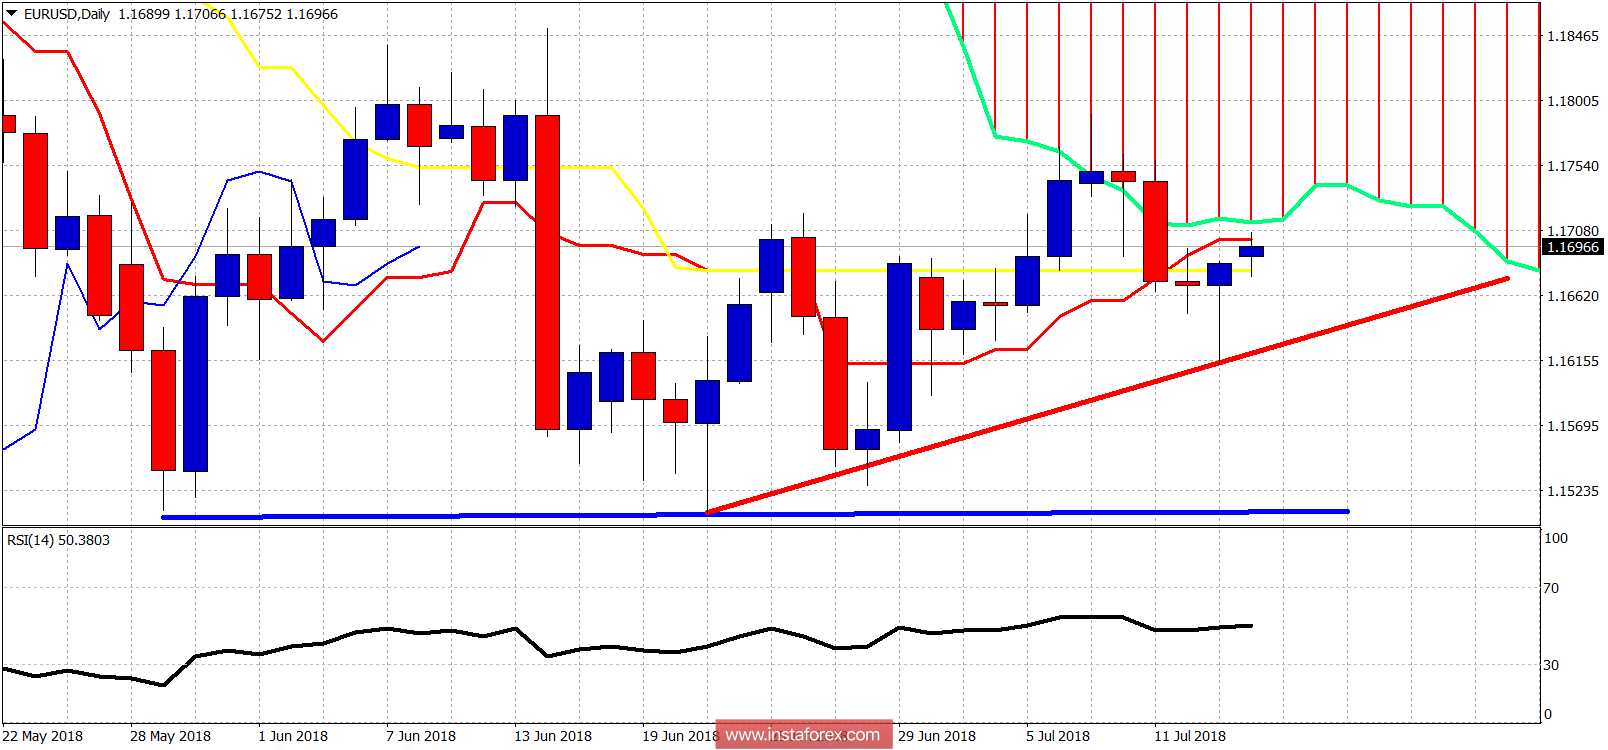
Blue line - critical support
EUR/USD has resistance at 1.17-1.1760. As long as price is below this area we should expect EUR/USD to move lower. Support is at 1.1625-1.1615. Breaking below this level will open the way for a move towards the 1.15 support. If bulls manage to close price above 1.1760 we could see a push higher towards 1.1850-1.19.


