


EUR/USD is showing short-term strength signs. After the daily bullish hammer reversal pattern we noted regarding Friday's candlestick, EUR/USD continues higher into resistance area.
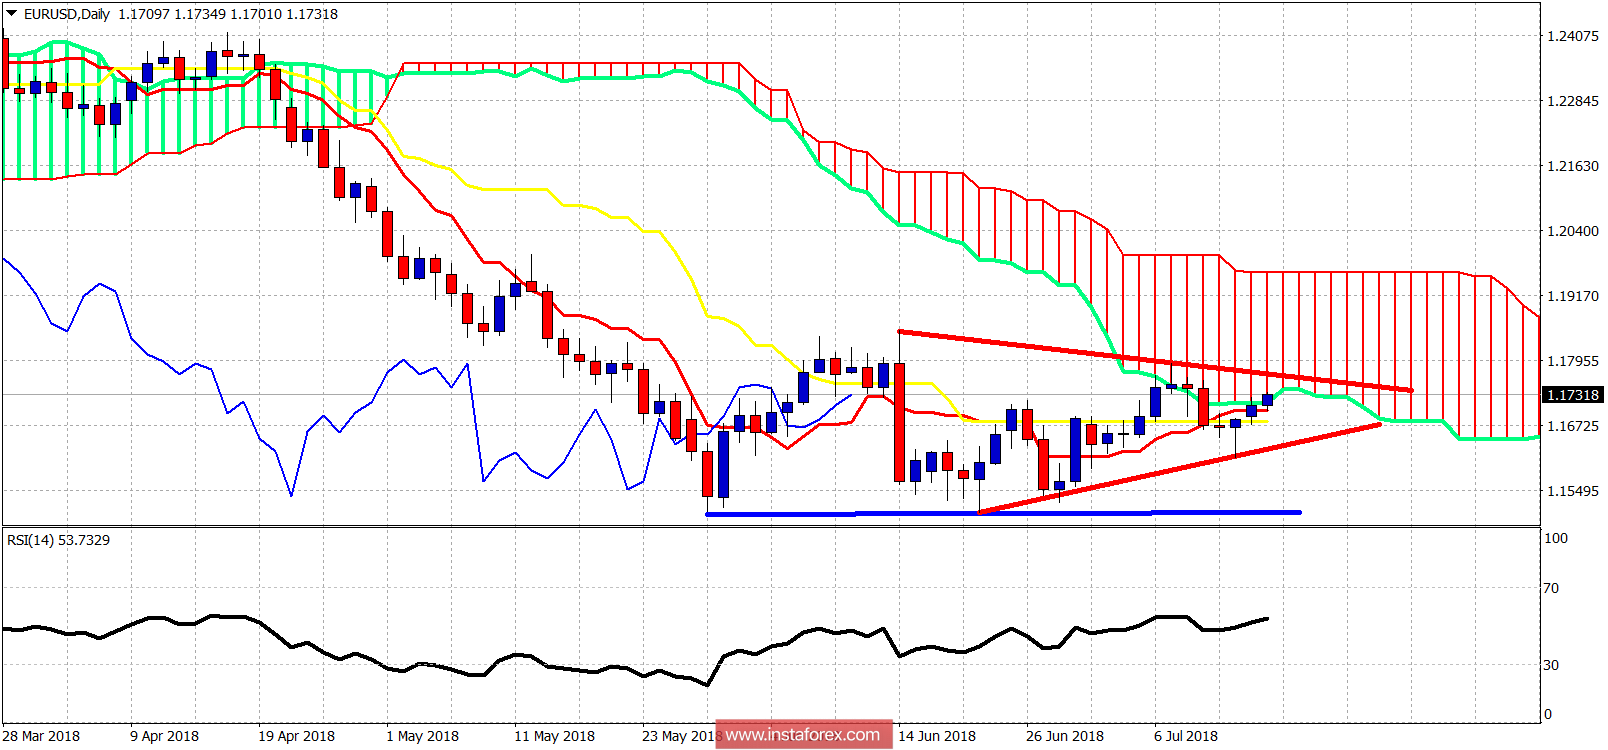
Blue line - support
The EUR/USD is challenging Daily cloud resistance. If price manages to remain inside the cloud and break above the upper triangle resistance at 1.1770 we should expect the price to move towards the upper cloud boundary near 1.1960. A rejection at the 1.1730-1.1760 area will open the way for a test of the lower triangle boundary at 1.1620-1.1630. Shorter-term support is found at 1.1660-1.1670. While short-term resistance is at 1.1740. A break below 1.1620 will open the way for a break of the 1.15 support and a move towards 1.12.


