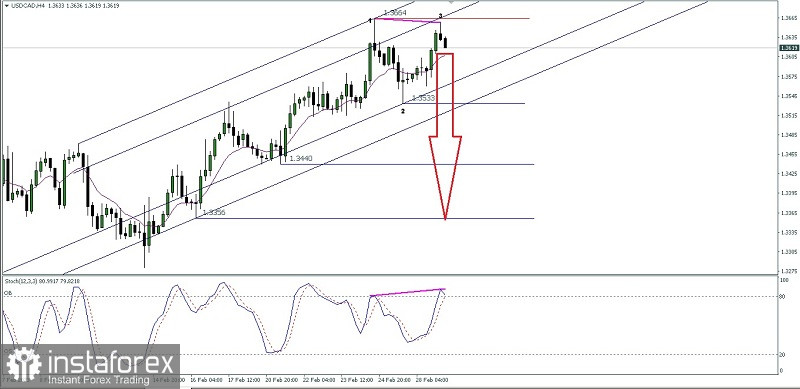
If we look on the 4 hour chart The Loonie then there will be 2 important things:
1. The appearance of Bearish 123 pattern.
2. There is a hidden deviation between Price movement with Stochastic Oscillator indicator.
Based on two things above then as long as USD/CAD back to break above the level 1,3658 on the nearest time has the potential to go down to test the level of 1,3533. If this level successfully broken then level 1,3440 will become the next main target to pursue and level 1,3356 will be the second target to test later.
(Disclaimer)


