


The Gold price made a new low yesterday, but prices reversed strongly after comments by the President of the U.S. regarding Fed policy, affecting the Dollar and in result Gold prices as well. Technically Gold has made a reversal pattern and the price continues to trade inside a downward sloping wedge pattern.
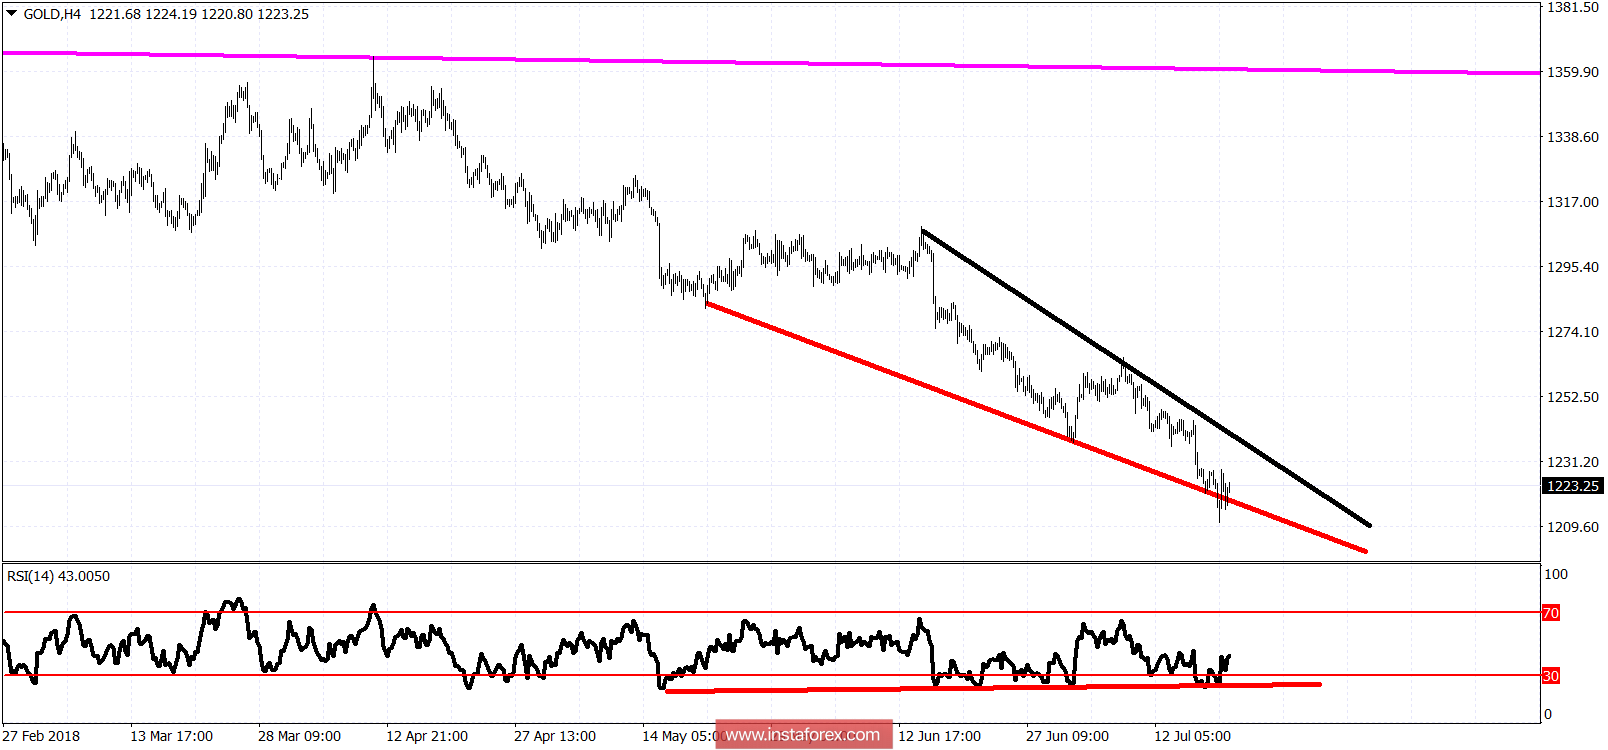
Black line - resistance trend line
The Gold price remains in a bearish trend. Bulls need to break the wedge pattern to the upside if they want to change trend to bullish. Resistance is at $1,235-45. A weekly close inside or above this area will be a bullish signal as a weekly bullish hammer would have shaped. Short-term support is at $1.215 and next at $1,200.


