


Gold price has bounced finally from the $1,210 area towards $1,230. Price remains inside the bullish wedge pattern. Gold price remains in a bearish trend, but we have some reversal signs from last week. Bulls need to built on that in order for more upside to come.
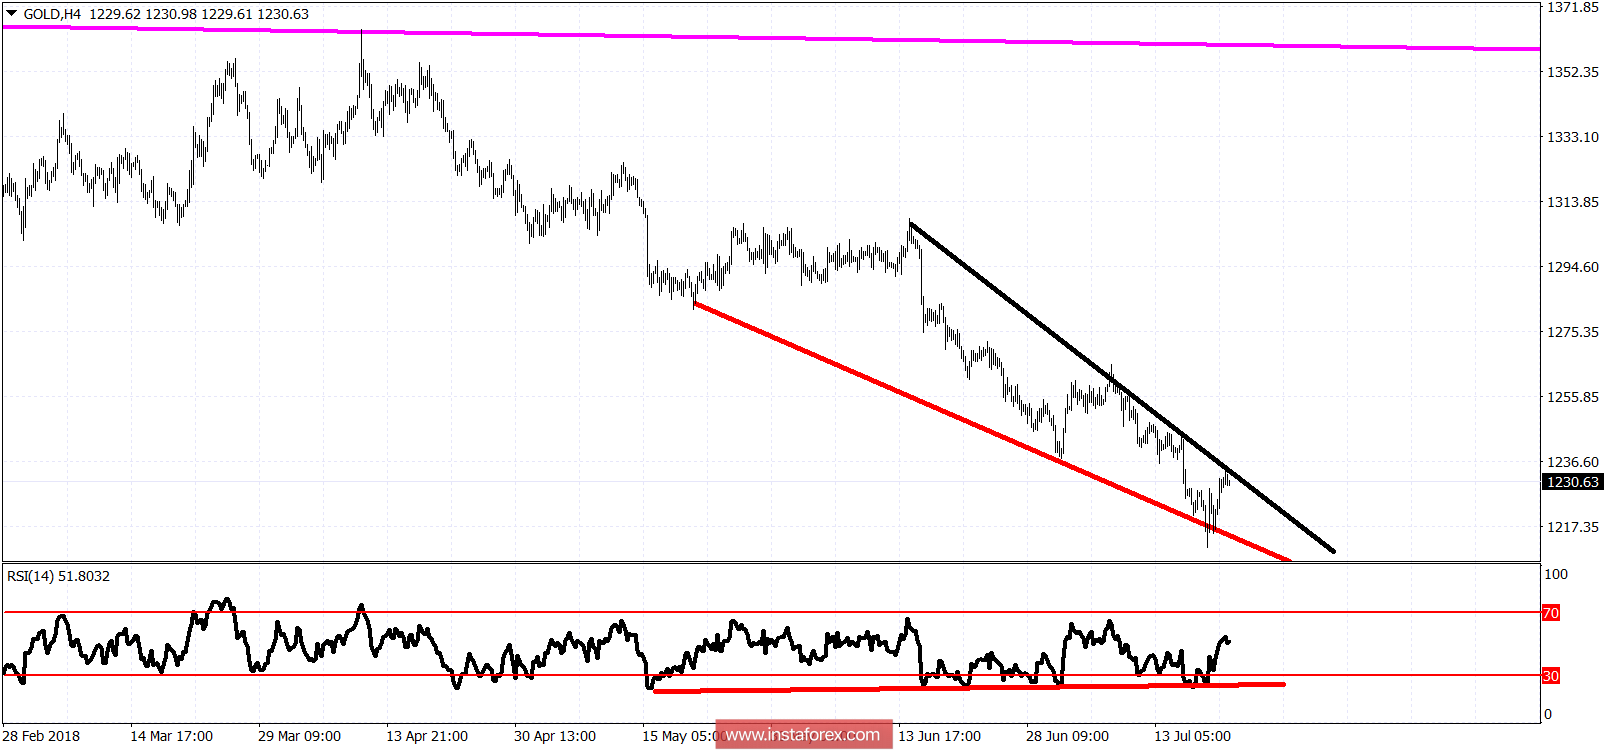
Black line - resistance
Red line - support
Upward sloping red line - bullish divergence
Short-term resistance and wedge pattern resistance is at $1,235. A break above it will be a bullish sign. Breaking the downward sloping wedge will be a bullish sign that could bring Gold price back towards $1,300. A break below $1,215 could push Gold price towards $1,200 or even below it.


