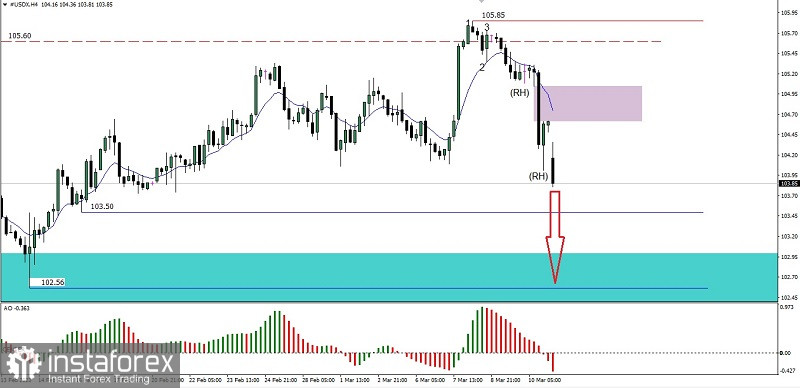
On the 4-hour chart #USDX you can see the emergence of a Bearish 123 pattern followed by the appearance of several Bearish Ross Hook (RH) and price movements that move below the EMA 10 so it is clear that in the near future USDX will try to test and break below the 103.50 level if This level is successfully broken down, so the next level to aim for is the 102.56 level. However, if on its way to the target levels described earlier, #USDX suddenly experiences a significant upward correction movement to break above the 105.24 level, then a decline scenario is certain. that was just described will be invalid and automatically cancel by itself.
(Disclaimer)


