


Gold price remains trapped inside the downward sloping wedge pattern. Trend remains bearish as long as price is below $1,235. Next support is at $1,217 and next at $1,204. Gold is vulnerable to the downside as long as price does not break out above the wedge pattern.
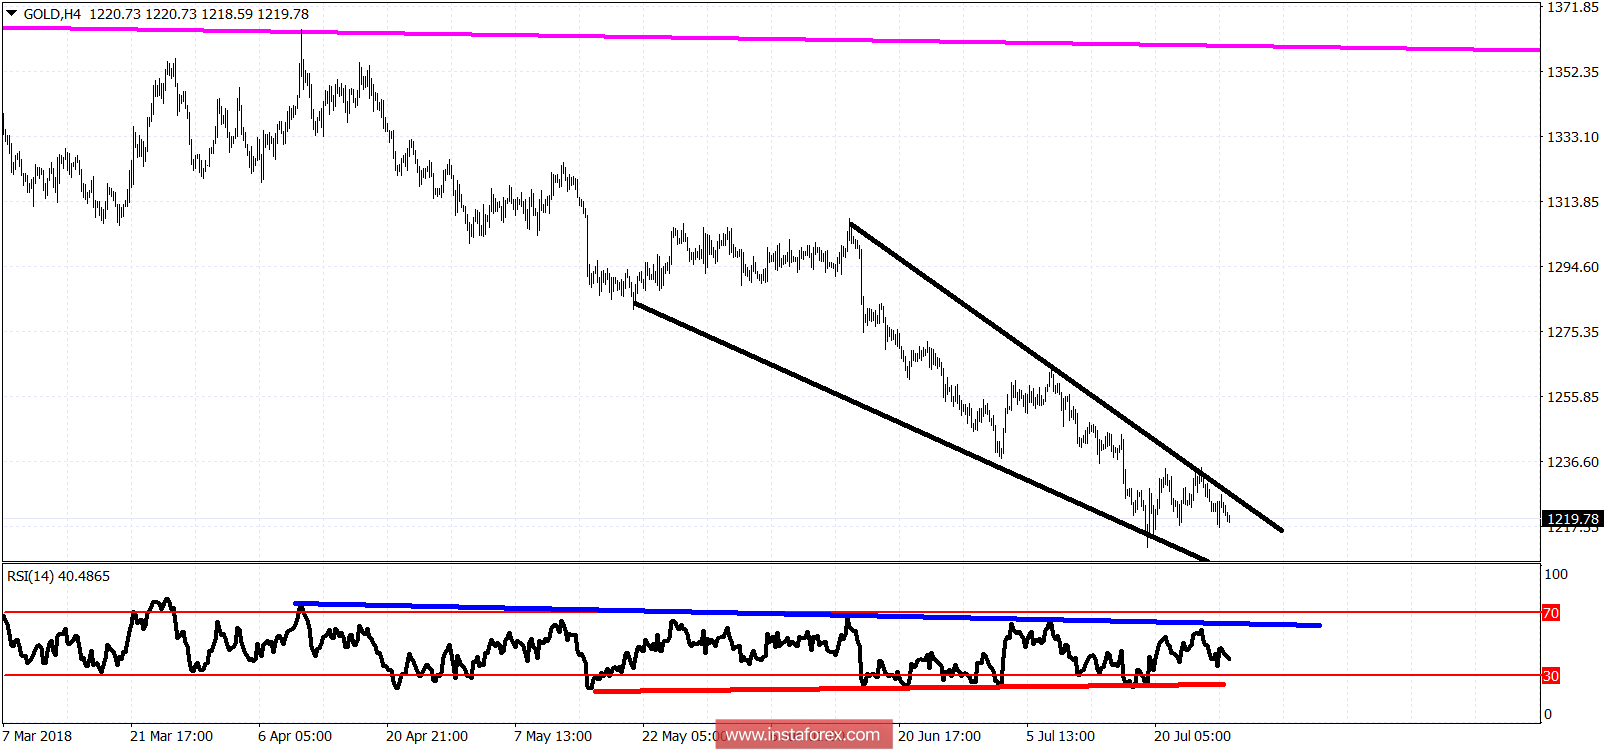
Blue line - RSI resistance
Red line -RSI support
Magenta line -long-term resistance
Resistance is very important at $1,235. A break above this level could open the way for a bounce even towards $1,300. Until then trend remains bearish targeting the lower wedge pattern boundary at $1,204. Gold price is oversold with bullish divergence signs. These signs are just warnings. We need a break above $1,235 to get the reversal confirmation.


