


The Gold price got rejected at the short-term resistance at $1,225 and is now challenging recent lows at $1,216. The trend remains bearish with price trapped inside the downward sloping wedge pattern. Bulls need to overcome $1,225 for a tradeable big bounce that could lead to $1,300. Until then we can expect the Gold price to reach $1,204.
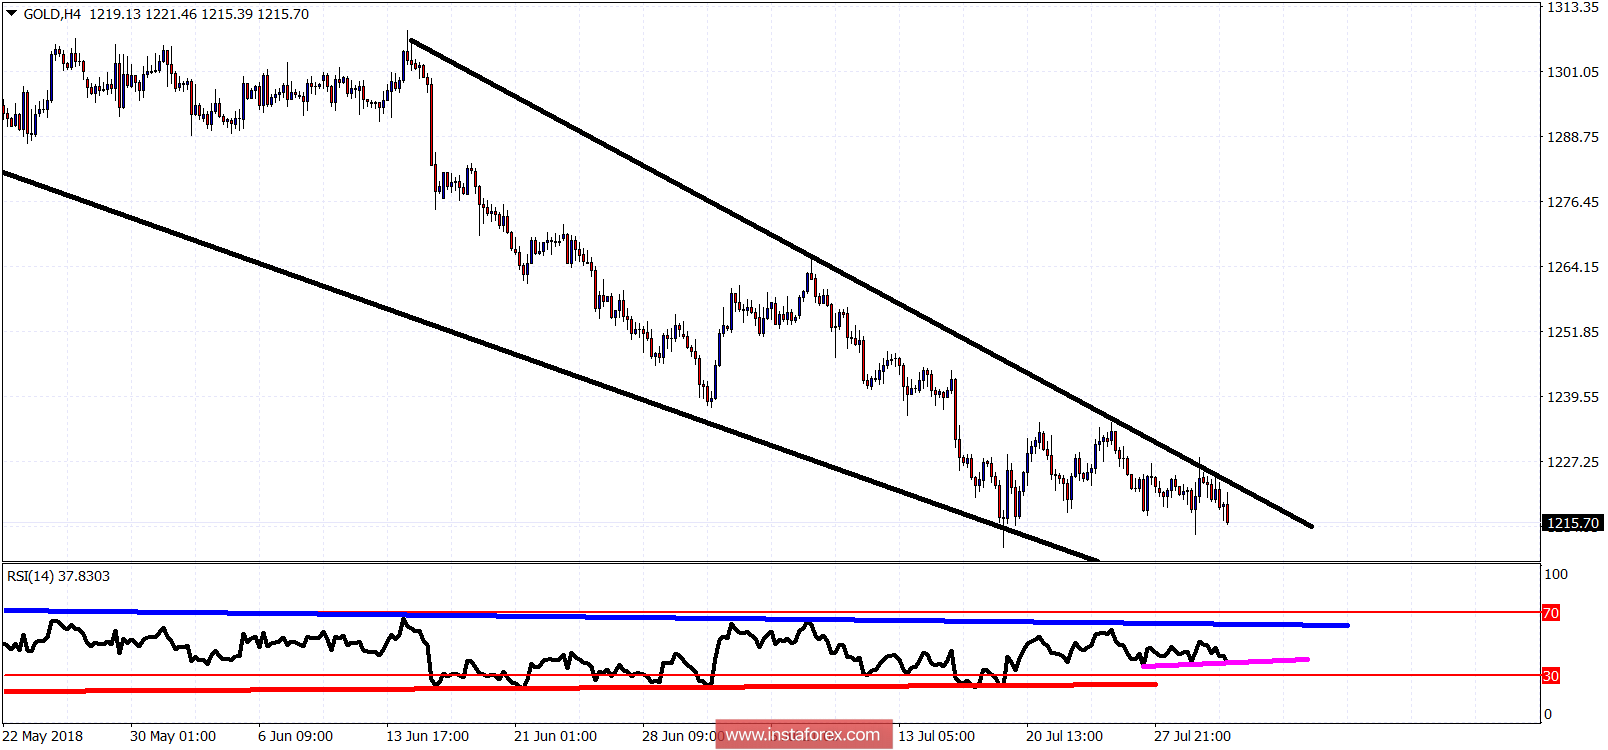
Blue line - RSI resistance
Magenta line - short-term bullish divergence
Red line - medium-term bullish divergence
The Gold price despite the new lows continues to provide us with bullish divergence signs. This downward move will resolve to a big upward short squeeze but as long as the price is below $1,225 I have little hopes left for the bullish view. Bulls have not shown any sign of strength lately. Bears are in full control of the trend. Next target is at $1,204. Break $1,225 and we can start a big bounce.


