


The Gold price is making new lower lows towards $1,204-207 as expected after breaking below $1,217. Support levels are broken one after the other. Gold price remains in a bearish trend, oversold, inside the downward sloping wedge pattern. Next target is at $1,193.
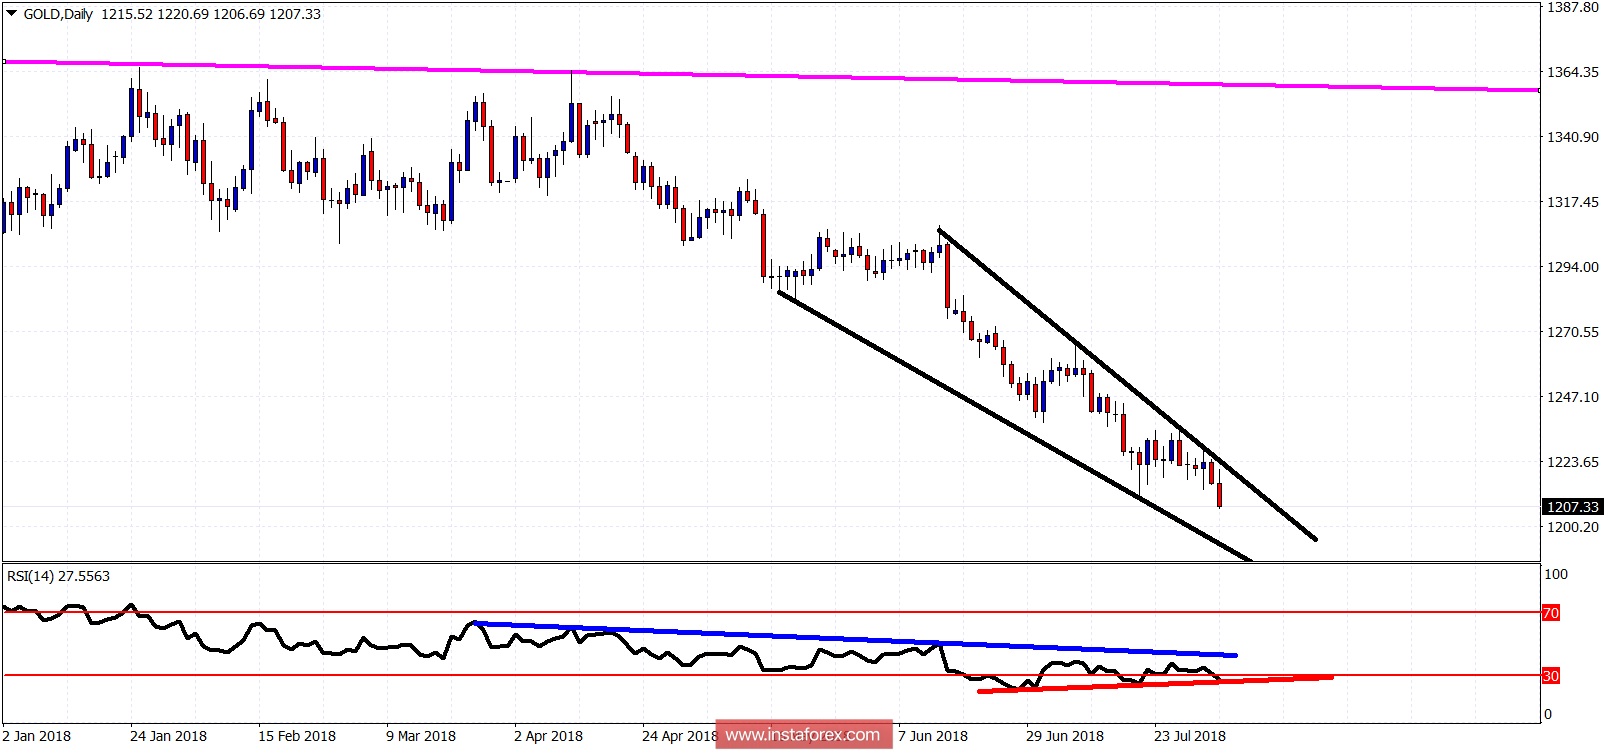
Black lines - wedge pattern
Red line - RSI Support
Blue line - RSI Resistance
The Gold price is making new lows. The Daily RSI is not. This is a bullish divergence. This is a bullish sign. But just a warning for bears. Not a reversal sign. For a reversal, we will first need a break above $1,225-28 area. Next support and the target area is at $1,193.


