


Nothing new for Gold today. Gold remains in a bearish trend inside a downward sloping wedge pattern. There are bullish divergence warning signs but as long as the Gold price is below $1,225 trend will remain bearish.
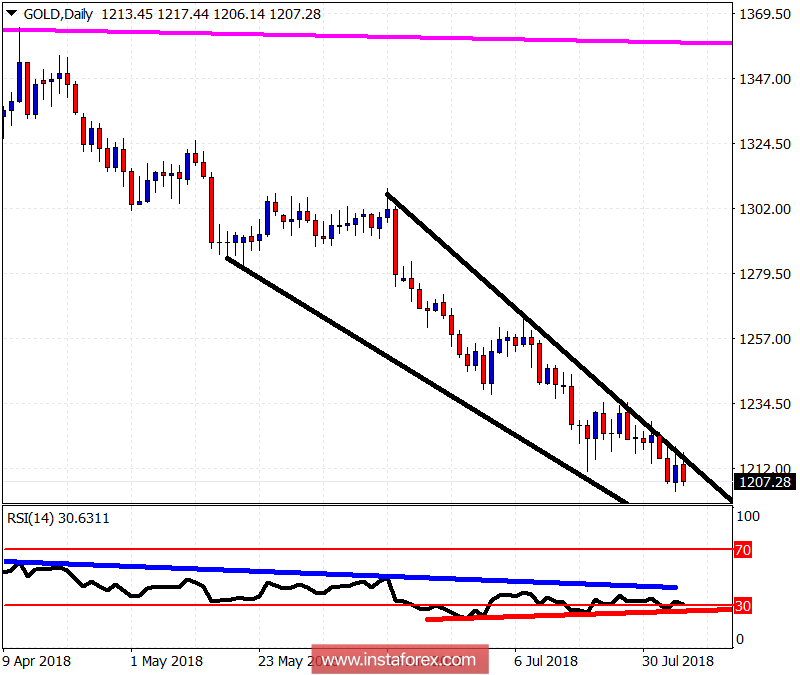
Blue line - RSI resistance
Red line - Bullish divergence
The Gold price has short-term resistance and trend change level at $1,225. However, a break above $1,217 will also be a bullish sign that will increase the chances of breaking above $1,225 dramatically. Support is at $1,185 where we find the lower wedge pattern boundary. The bullish divergence signs by the RSI and the fact that the RSI price remains above the red trend line support, make me not chase the bearish side of any trade but wait for a bullish reversal and follow the bounce towards $1,265-75 at least.


